
Technical Analysis for US Dollar, S&P 500, Gold and Crude Oil - Stalls at Trend Support for Crude Oil, Gold Drops to 3-Month Low

Prices areaccelerating upward anew, with prices on pace to challenge monthly highs. Near-term resistance is at 12018, the 38.2% Fibonacci expansion, with a break above that on a daily closing basis exposing the 50% level at 12067.
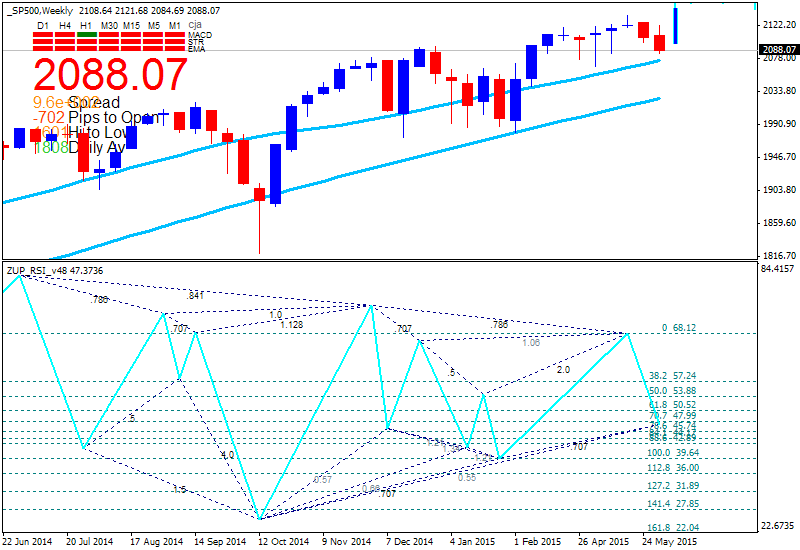
S&P 500 TECHNICAL ANALYSIS
Prices continued downward after breaking two-month trend support. Sellers are now challenging the 50% Fibonacci retracement at 2088.60, with a break below that exposing the 61.8% level at 2077.20.
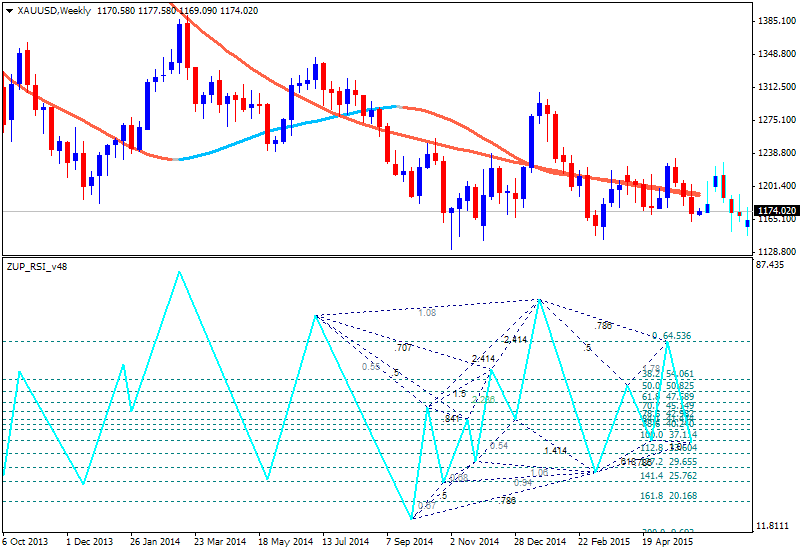
GOLD TECHNICAL ANALYSIS
Prices continue to push lower, now aiming to challenge support at 1164.36 marked by the 76.4% Fibonacci expansion. A break below that exposes the 100% level at 1152.05. Alternatively, a reversal back above the 61.8% Fib at 1171.98 targets the 50% expansion at 1178.14.
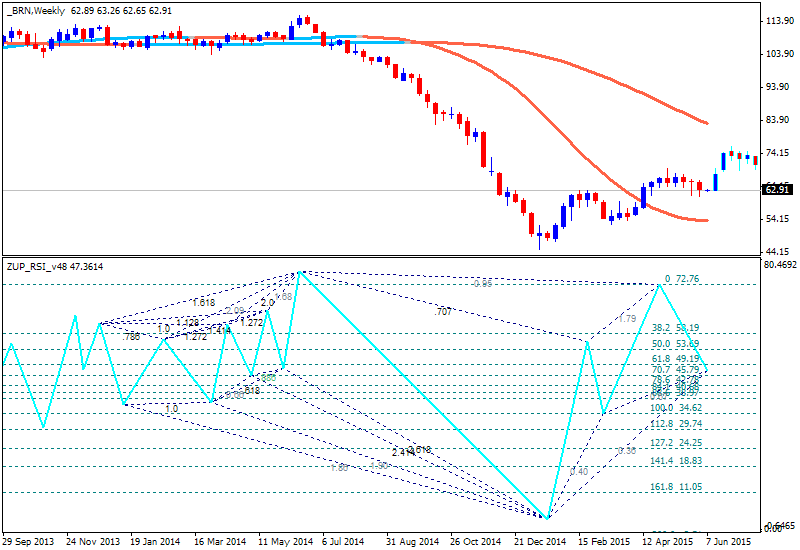
CRUDE OIL TECHNICAL ANALYSIS
Prices continue to test support at a rising trend line guiding the move higher since mid-January. A break below this barrier (now at 62.35) exposes the 38.2% Fibonacci retracement 60.27. Alternatively, a reversal above downward-sloping resistance at 65.42 targets the May 6 high at 69.60.


")
