
Technical Analysis for US Dollar, S&P 500, Gold and Crude Oil - followed by the 38.2% Fibonacci expansion at 70.57 for oil
4 June 2015, 12:11

3
1 105
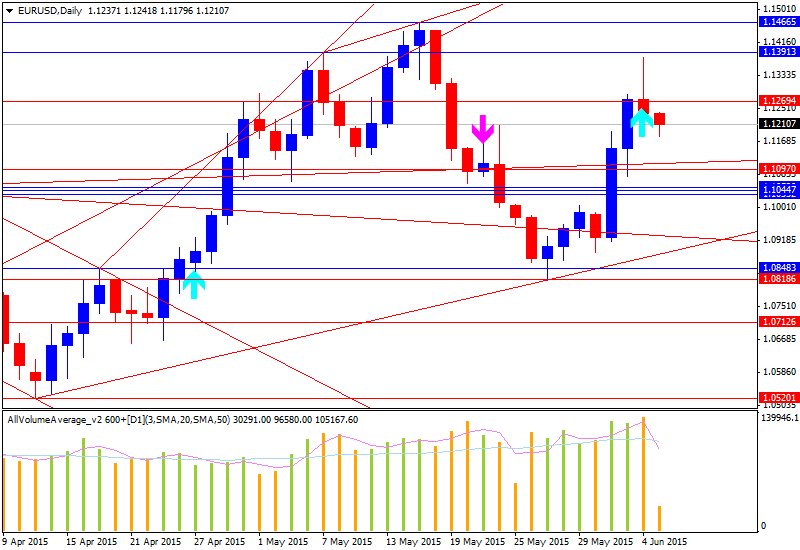
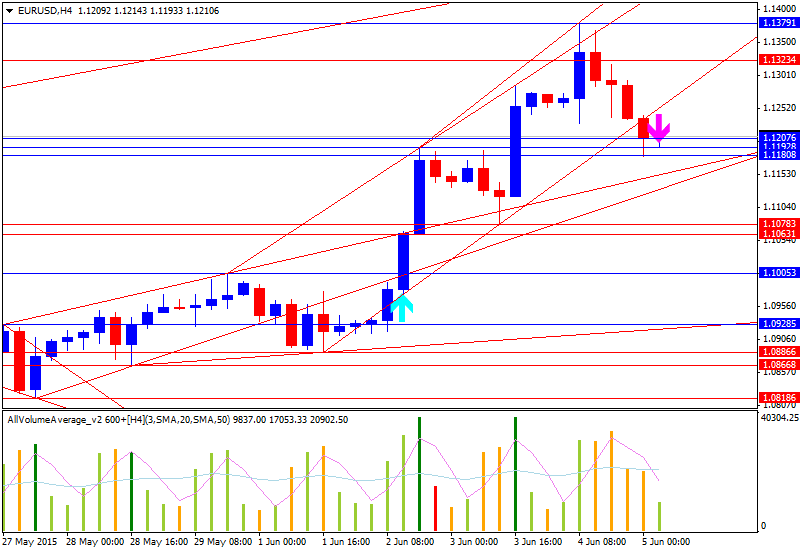
US DOLLAR TECHNICAL ANALYSIS
Prices turned sharply lower, producing the largest decline in close to three months. A daily close below the 23.6% Fibonacci retracement at 11918 exposes the 38.2% level at 11841.
S&P 500 TECHNICAL ANALYSIS
Prices remain in consolidation mode. A break below trend line support at 2107.80 exposes the 38.2% Fibonacci retracement at 2100.00.
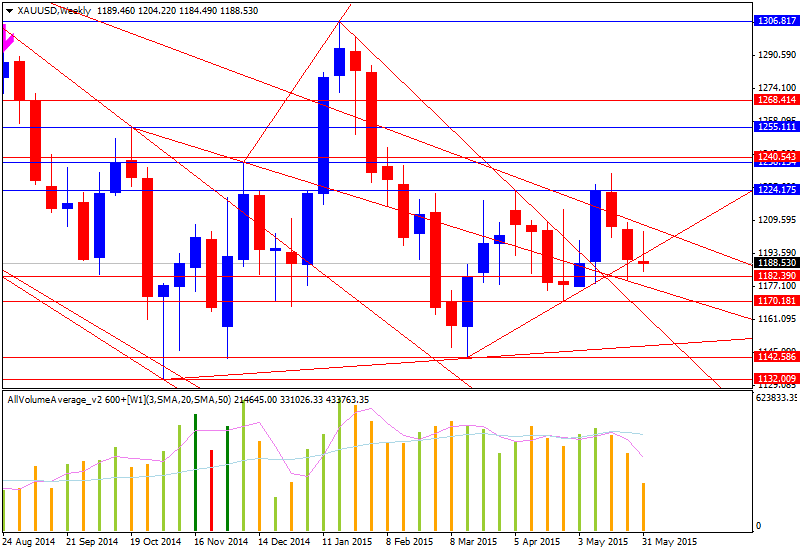
GOLD TECHNICAL ANALYSIS
Prices are digesting
losses after claiming a foothold below the $1200/oz figure anew. A close
below range support at 1178.09 exposes the 38.2% Fibonacci expansion at
1169.31. Alternatively, a rebound above the 23.6% level at 1193.38
targets trend line support-turned-resistance at 1203.33.
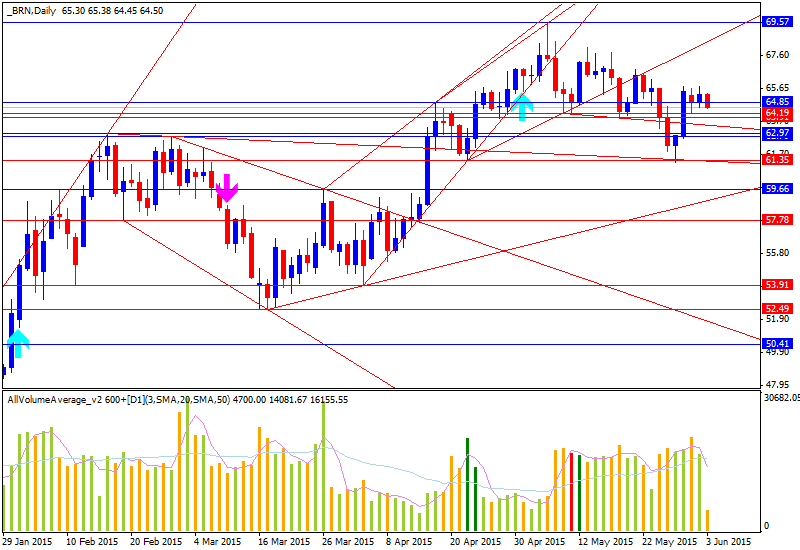
CRUDE OIL TECHNICAL ANALYSIS
Prices rebounded from
support guiding the up move from lows set in mid-January. A push above
downward-sloping resistance at 65.77 exposes the May 6 high at 69.60,
followed by the 38.2% Fibonacci expansion at 70.57. Alternatively, a
move below trend line support at 61.81 targets the 38.2% Fib retracement
at 60.27.


")

")