Gold – Silver Correction - Break out from a Descending Triangle
16 August 2014, 16:16

0
471
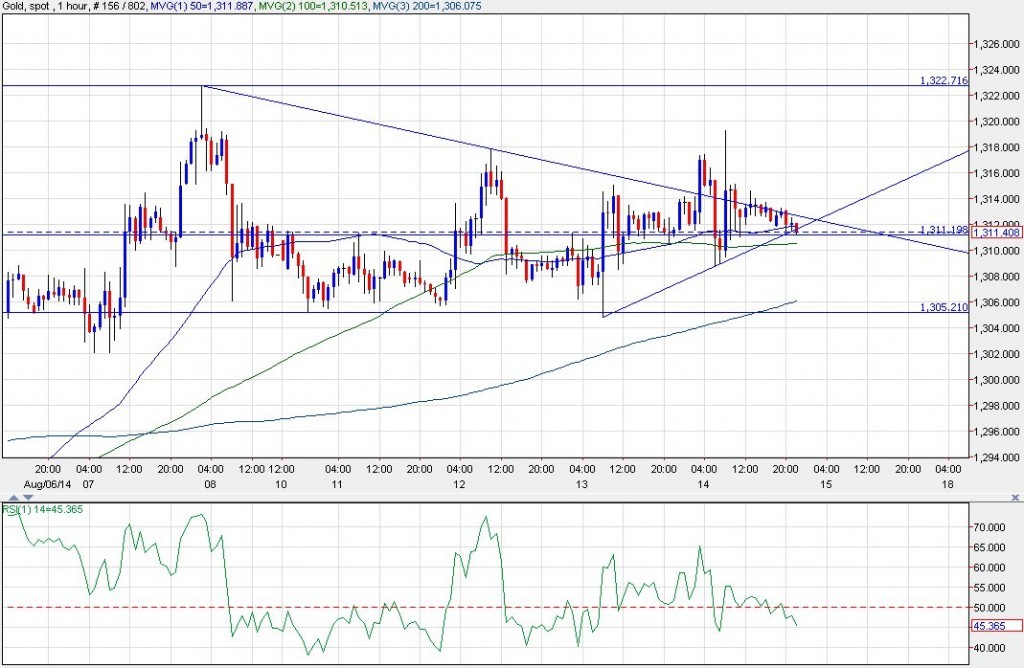
Gold has been consolidating in a descending triangle this week after it found resistance at about 1322. Note the bullish bias in the 1H chart.
- Price was bullish at the end of last week, so the prevailing trend in the 1H chart is bullish before it consolidated this week.
- Price is for the most part trying to stay above the 200-, 100-, and 50-hour simple moving averages, which would reflect a bullish market.
- Price broke above the descending triangle resistance today.
Gold (XAU/USD) 1H Chart
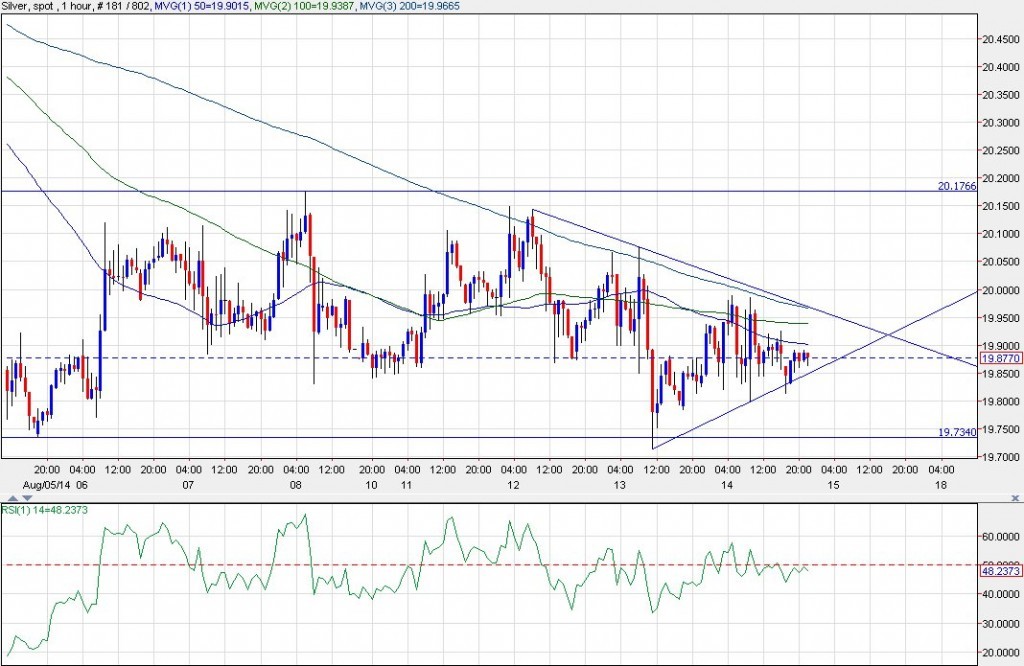
Silver (XAG/USD)
Silver has entered a period of consolidation as well. It has been mostly
sideways with the 19.73 area as support, and 20.17 area as resistance.
There is a divergence between gold and silver. You can see that gold is
consolidating after a bullish swing because the moving averages were
upward sloping in the 1H chart. The moving averages in silver’s 1h
charts, are downsloping.
For silver, a break above 20.00 will be needed to put away some bearish
bias in the short-term, and a break above 2.20 would put in a price
bottom for a bullish outlook.
Silver (XAG/USD) 1H Chart