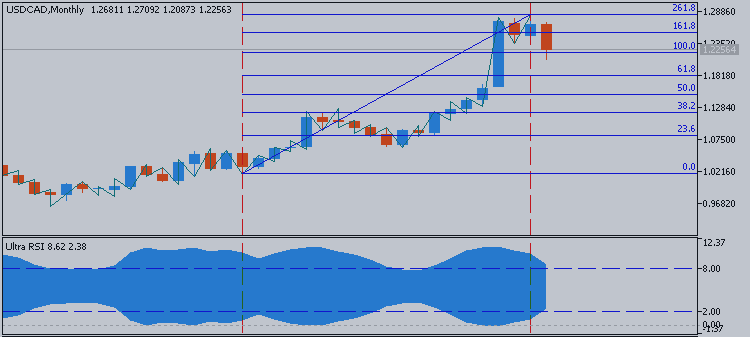
USDCAD May-December 2015 Forecast: ranging to correction within the bullish to be started with 1.2834 resistance level
12 May 2015, 07:11
0
587
- Tenkan-sen line is located above Kijun-sen line of Ichimoku indicator with 1.2834 resistance level on monthly timeframe chart for the bullish market condition to be continuing.
- Senkou Span A line of Ichimoku indicator is located far below the price which is indicating the primary bullish market condition up to the end of the year
- Primary bullish market condition was estimated by AbsoluteStrength indicator and TrendStrength indicators with the secondary ranging which was started in the beginning of March on monthly close bar.
- Chinkou
Span line is located to be too far for any possible
breakout or breakdown of the price movement in 2015 on monthly timeframe
- Nearest support levels are 1.1312 and 1.0820
- Nearest resistance level is 1.2834

If MN price will break 1.1312
support level on close monthly bar so the secondary correction will be started within the primary bullish market condition
If MN price will break 1.2834 resistance level so we may the bullish trend to be continuing up to the end of this year
If not so the price will be ranging between 1.2834 and 1.1312 levels
| Resistance | Support |
|---|---|
| 1.2834 | 1.1312 |
| N/A | 1.0820 |
Trend: ranging bullish


