
Technical Analysis for US Dollar, S&P 500, Gold and Crude Oil - Consolidation

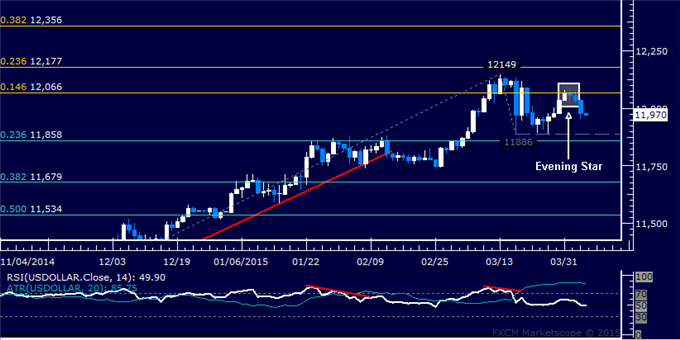
Prices declined as expected after putting in a bearish Evening Star candlestick pattern. Near-term support is in the 11858-86 area (March 18 low, 23.6% Fibonacci retracement), with a break below that on a daily closing basis exposing the 38.2% level at 11679.
S&P 500 TECHNICAL ANALYSIS
Prices moved lower as expected
after putting in a bearish Evening Star candlestick pattern. A daily
close below the March 12low at 2040.10 exposes the 38.2% Fibonacci
retracement at 2004.60. Alternatively, a reversal above the 14.6% Fib
expansion at 2084.00 targets the 2111.00-19.40 area (23.6% threshold,
February 25 high).

GOLD TECHNICAL ANALYSIS
Prices look poised to continue higher
after clearing resistance at 1210.35, the 38.2% Fibonacci expansion.
From here, a daily close above the 50% level at 1231.28 exposes the
61.8% Fib at 1252.22. Alternatively, a reversal back below 1210.35
targets the March 31 low at 1178.38.

CRUDE OIL TECHNICAL ANALYSIS
Prices continue to tread water
below the $60/barrel figure. A close above the March 26 high at 59.75
exposes the February 17 top at 62.98. Alternatively, a push below the
14.6% Fibonacci expansion at 52.76 targets the 23.6% level at 46.47.


 & AMD Framework")
")