
Technical Pattern Analysis for US Dollar, S&P 500, Gold and Crude Oil - Price jumps most in 2 months following Dark Cloud Cover pattern

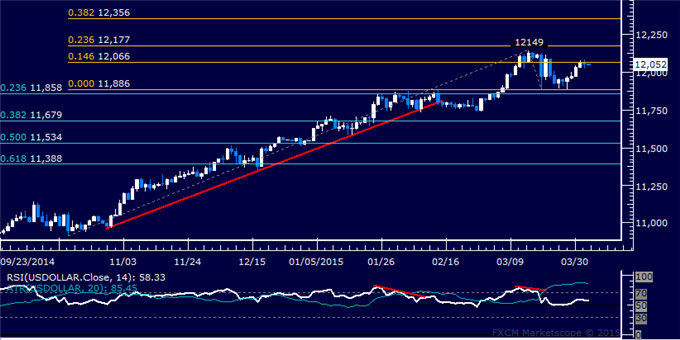
US DOLLAR TECHNICAL ANALYSIS
Prices paused to digest gains,
snapping a four-day winning streak. Near-term resistance is at 12066,
the 14.6% Fibonacci expansion, with a break above that on a daily
closing basis exposing the 12149-77 zone (23.6% level, March 13 high).
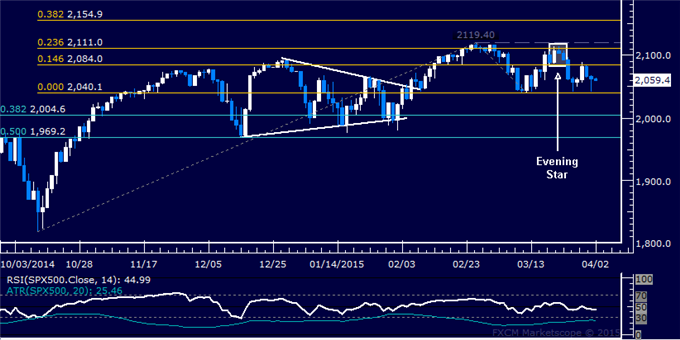
S&P 500 TECHNICAL ANALYSIS
Prices moved lower as expected
after putting in a bearish Evening Star candlestick pattern. A daily
close below the March 12low at 2040.10 exposes the 38.2% Fibonacci
retracement at 2004.60. Alternatively, a reversal above the 14.6% Fib
expansion at 2084.00 targets the 2111.00-19.40 area (23.6% threshold,
February 25 high).
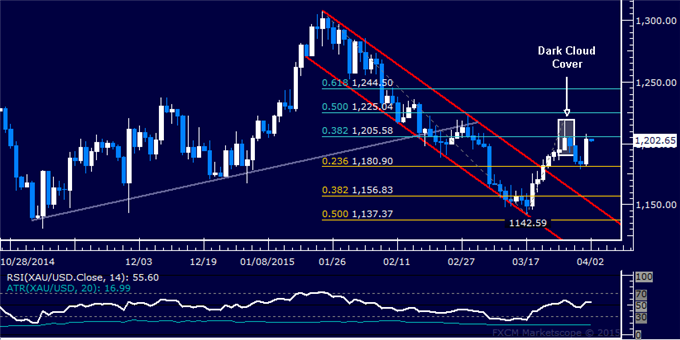
GOLD TECHNICAL ANALYSIS
Prices recoiled sharply higher after
declining as expected following the appearance of a bearish Dark Cloud
Cover candlestick pattern. A daily close above the 38.2% Fibonacci
retracement at 1205.58 exposes the 50% level at 1225.04. Alternatively, a
push below the 23.6% Fib expansion at 1180.90 targets the 38.2%
threshold at 1156.83.
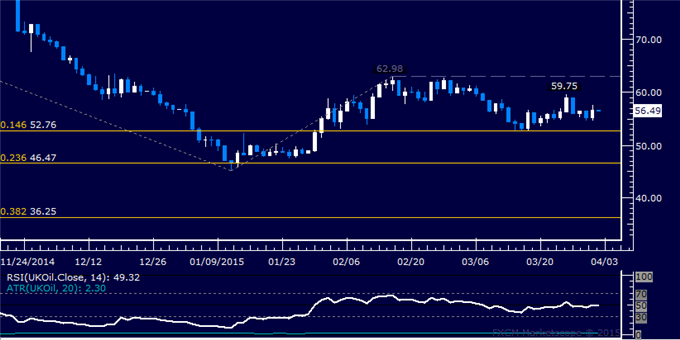
CRUDE OIL TECHNICAL ANALYSIS
Prices continue to tread water
below the $60/barrel figure. A close above the March 26 high at 59.75
exposes the February 17 top at 62.98. Alternatively, a push below the
14.6% Fibonacci expansion at 52.76 targets the 23.6% level at 46.47.


")
