Technical Candlestick Pattern Analysis for US Dollar, S&P 500, Gold and Crude Oil - Crude Oil Stalls Below $63, Gold Holds Up at $1200

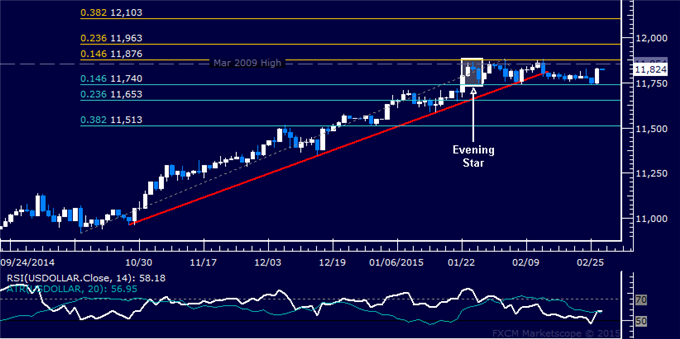
US DOLLAR TECHNICAL ANALYSIS
Prices issued its largest advance
in a month but prices failed to overcome range resistance to secure a
breakout. Near-term resistance is in the 11854-76 area (14.6% Fibonacci
expansion, March 2009 high), with a break above that on a daily closing
basis exposing the 23.6% level at 11963.
S&P 500 TECHNICAL ANALYSIS
Prices paused to digest gains
after advancing to yet another record high. A daily close above the
14.6% Fibonacci expansion at 2121.80 exposes the 23.6% level at 2133.70.
Near-term support is at 2102.60, the February 23 low.

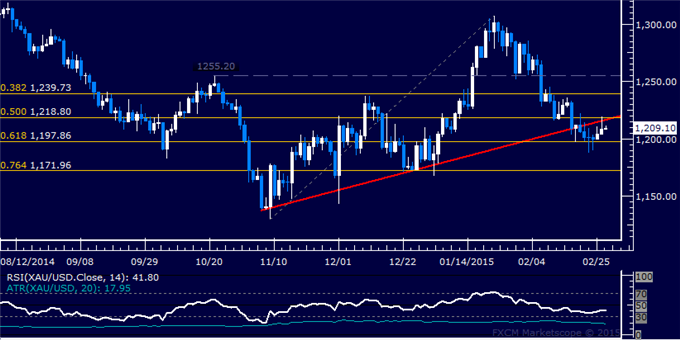
GOLD TECHNICAL ANALYSIS
Prices has stalled above interim
support at 1197.86, the 61.8% Fibonacci retracement. A break above the
intersection of trend line support-turned-resistance and the 50% level
at 1218.80 exposes the 38.2% Fib at 1239.73. Alternatively, a turn below
1197.86 targets the 76.4% retracement at 1171.96.
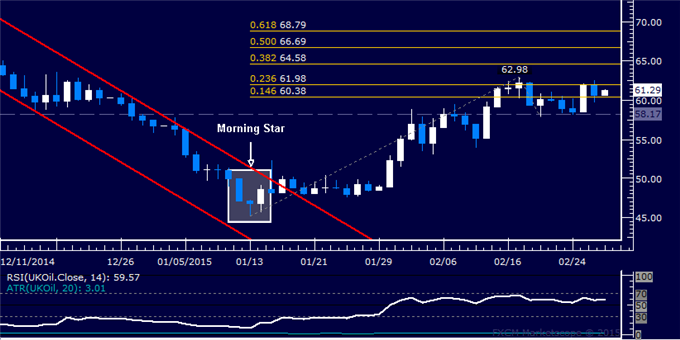
CRUDE OIL TECHNICAL ANALYSIS
Prices launched a recovery as
expected, with buyers now attempting to reclaim momentum after a brief
pullback. A break above the 23.6% Fibonacci expansion at 61.98 exposes
the February 17 high at 62.98, followed by the 38.2% level at 64.58.
Alternatively, a reversal below the 14.6% Fib at 60.38 targets
resistance-turned-support at 58.17.