
0
267
The
Currency Score analysis is one of the parameters used for the
Ranking and Rating list which was published earlier this weekend.
Besides this analysis and the corresponding chart I also provide the
weekly analysis on my strategy
and the Forex ranking and rating list which is available 3 times a week
on this blog.
This article has been polished and brought to a higher level by the modifications implemented. It is recommended to read the page Currency score explained and Models in practice for a better understanding of the articles and the new modifications. This article will provide my analysis on the 8 major currencies based on the technical analysis charts using the MACD and Ichimoku indicator on 4 time frames, the monthly, weekly, daily and 4 hours. The result of the technical analysis are the 2 screenshots in this article showing the Currency Score and the Currency Score Difference.
For analyzing the best pairs to trade this classification is the first point to start with. When looking at the most recent score that is being used for the coming period we can see in the screenshot below that the NZD is having a score of 5 and the JPY a score of 4. A strong currency should have by preference a score of 6 or higher and a weak currency a score of 3 or lower. The GBP swithed places with the NZD and the CAD swithed with the JPY. This is the same situation as the previous week.
According to the Ranking and Rating list already published this weekend the following pair combinations look interesting. The CHF is still being avoided because the daily charts are not yet good to read because of the heavy price movement when the EUR/CHF floor was taken away.
The technical analysis is the most important before taking positions. The Weekly Chart is being analyzed. I prefer the Bollinger Band for defining where a pair is in the chart. Once a pair is outside a Bollinger Band it is in a strong trend which can cause a strong pullback. Although it may be for other analysts a good opportunity I avoid taking positions because of the possible unexpected strong pullback. Positions are only opened inside the Bollinger Band and this may be at the start of a possible trend or on a good pullback in an existing trend.
When trading according to the FxTaTrader Strategy some rules are in place. For more information see the page on my blog FxTaTrader Strategy. Depending on the opportunities that may come up the decision to trade a currency may become more obvious at that moment.
DISCLAIMER: The articles are my personal opinion, not recommendations, FX trading is risky and not suitable for everyone.The content is for educational purposes only and is aimed solely for the use by ‘experienced’ traders in the FOREX market as the contents are intended to be understood by professional users who are fully aware of the inherent risks in forex trading. The content is for 'Forex Trading Journal' purpose only. Nothing should be construed as recommendation to purchase any financial instruments. The choice and risk is always yours. Thank you.
This article has been polished and brought to a higher level by the modifications implemented. It is recommended to read the page Currency score explained and Models in practice for a better understanding of the articles and the new modifications. This article will provide my analysis on the 8 major currencies based on the technical analysis charts using the MACD and Ichimoku indicator on 4 time frames, the monthly, weekly, daily and 4 hours. The result of the technical analysis are the 2 screenshots in this article showing the Currency Score and the Currency Score Difference.
___________________________________________
Last 3 months currency classification
The last 3 months currency
classification from a longer term
perspective
are provided for reference
purposes. See for more information the article: Weekly Currency Score Wk03 where
the charts are available. The currencies are
classified for the coming weeks as follows:
- Strong: CHF / USD / NZD
- Average: GBP /CAD
- Weak: EUR / JPY / AUD
___________________________________________
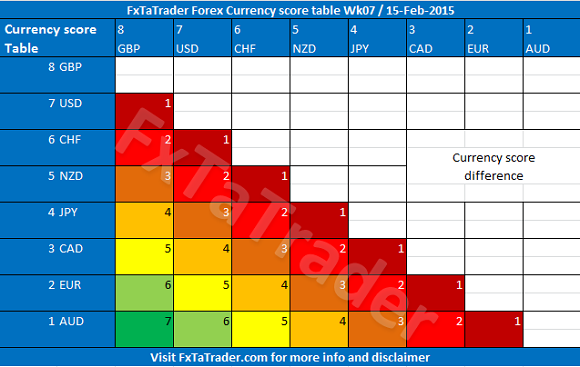
Currency Score
For analyzing the best pairs to trade this classification is the first point to start with. When looking at the most recent score that is being used for the coming period we can see in the screenshot below that the NZD is having a score of 5 and the JPY a score of 4. A strong currency should have by preference a score of 6 or higher and a weak currency a score of 3 or lower. The GBP swithed places with the NZD and the CAD swithed with the JPY. This is the same situation as the previous week.
- Most of the currencies are at the right level and some differ with just 1 point.
- There is no significant pullback in any of the currencies at the moment.
- The pairs that we will look at are all most
probably trending.

___________________________________________
Currency
Score difference
According to the Ranking and Rating list already published this weekend the following pair combinations look interesting. The CHF is still being avoided because the daily charts are not yet good to read because of the heavy price movement when the EUR/CHF floor was taken away.
- GBP/AUD with the EUR/NZD
- GBP/CAD with the EUR/USD
- EUR/GBP with the AUD/USD
- AUD/USD with the GBP/CAD
The technical analysis is the most important before taking positions. The Weekly Chart is being analyzed. I prefer the Bollinger Band for defining where a pair is in the chart. Once a pair is outside a Bollinger Band it is in a strong trend which can cause a strong pullback. Although it may be for other analysts a good opportunity I avoid taking positions because of the possible unexpected strong pullback. Positions are only opened inside the Bollinger Band and this may be at the start of a possible trend or on a good pullback in an existing trend.
- The GBP/AUD is clearly in a trend but outside the Bollinger Band. However with the new value of the Bollinger Band next week price may be within again.
- The GBP/CAD is clearly in a trend but outside the Bollinger Band. However with the new value of the Bollinger Band next week price may be within again.
- The EUR/GBP is clearly in a trend but outside the Bollinger Band. However with the new value of the Bollinger Band next week price may be within again.
- The AUD/USD is clearly in a trend and nicely within the Bollinger Band.
- The EUR/USD is clearly in a trend and nicely within the Bollinger Band.
- The EUR/NZD looks like it is picking up the downtrend again and is clearly within the Bollinger Band.
When trading according to the FxTaTrader Strategy some rules are in place. For more information see the page on my blog FxTaTrader Strategy. Depending on the opportunities that may come up the decision to trade a currency may become more obvious at that moment.
___________________________________________
DISCLAIMER: The articles are my personal opinion, not recommendations, FX trading is risky and not suitable for everyone.The content is for educational purposes only and is aimed solely for the use by ‘experienced’ traders in the FOREX market as the contents are intended to be understood by professional users who are fully aware of the inherent risks in forex trading. The content is for 'Forex Trading Journal' purpose only. Nothing should be construed as recommendation to purchase any financial instruments. The choice and risk is always yours. Thank you.


