
Technical Analysis for US Dollar, S&P 500, Gold and Crude Oil - Crude Oil Stalling, Gold Sinks to Lowest Level in 4 Weeks

US DOLLAR TECHNICAL ANALYSIS
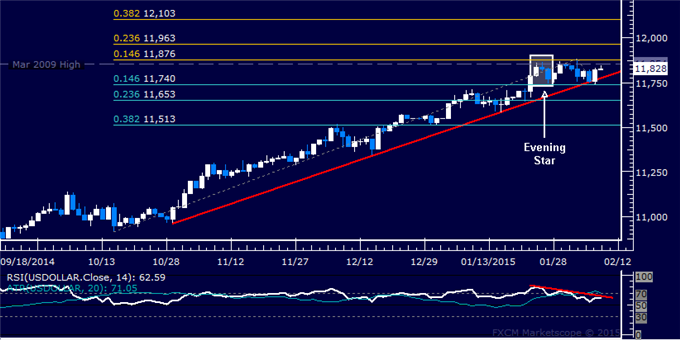
Prices may be preparing to decline
after prices put in a bearish Evening Star candlestick pattern.
Negative RSI divergence reinforces the case for a downside scenario.
Near-term trend line support is in the 11740-73 area, marked by a rising
trend line and the 14.6% Fibonacci retracement, with a break below that
on a daily closing basis exposing the 23.6% level at 11653.
S&P 500 TECHNICAL ANALYSIS
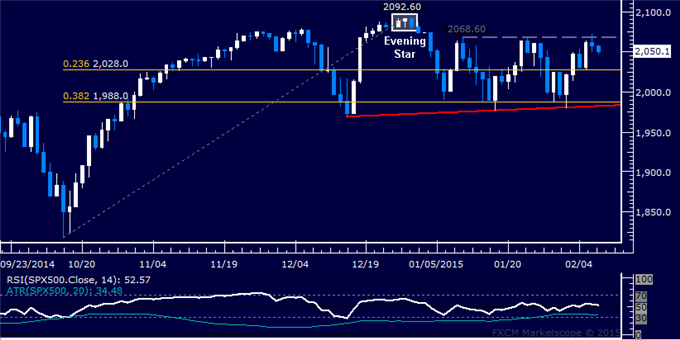
Prices are in consolidation mode
after declining as expected following the appearance of a bearish
Evening Star candlestick pattern. A daily close below the 23.6%
Fibonacci retracement at 2028.00 exposes the 1982.70-88.00 area marked
by the 38.2% level and a rising trend line.
GOLD TECHNICAL ANALYSIS
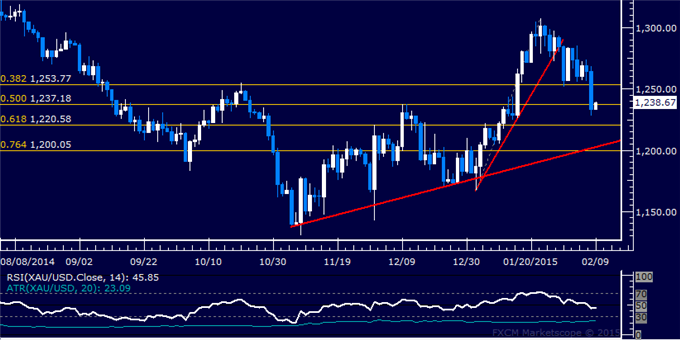
Prices resumed moving lower anew,
sliding to the weakest level in four weeks. Sellers now aim at 1220.58,
the 61.8% Fibonacci retracement, with a break below that exposing the
intersection of the 76.4% level and a rising trend line at 1200.05.
Alternatively, a move above the 50% Fib at 1237.18 targets the 38.2%
retracement at 1253.77.
CRUDE OIL TECHNICAL ANALYSIS
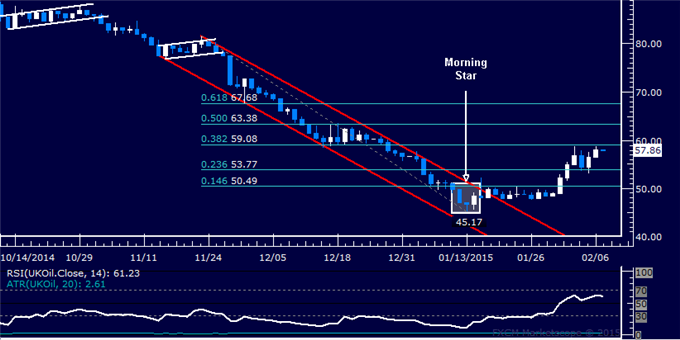
Prices pushed higher following a
prolonged period of consolidation after bottoming as expected above the
$45.00/barrel figure. A daily close above the 38.2% Fibonacci
retracement at 59.08 exposes the 50% level at 63.38. Alternatively, a
reversal below the 23.6% Fib at 53.77 targets the 14.6% retracement at
50.49.


")