
Technical Analysis for EURUSD, GBPUSD, AUDUSD, NZDUSD, USDJPY, USDCAD and USDCHF
22 September 2014, 03:11
0
281
EUR/USD
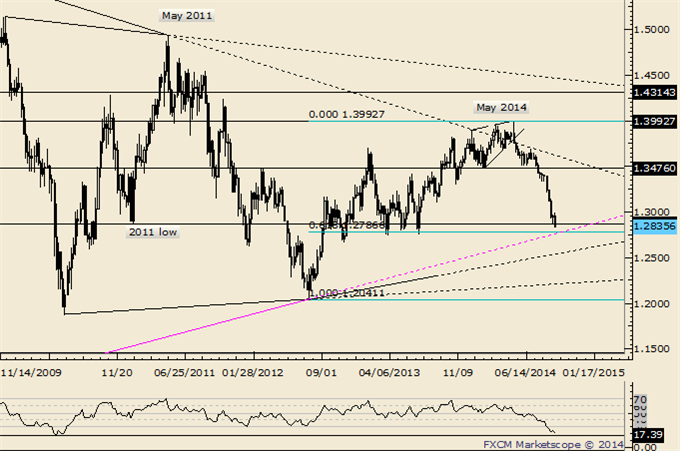
- “Long term, a failed breakout and top would keep with the pattern of 3 year cycle tops. The break of 1.3476 completed a topping process with targets of 1.3294 (origin of diagonal), 1.3209 (2 equal legs), and 1.3012 (head and shoulders target).”
- EURUSD crashed through all the objectives. and 1.3020
(50% from 2012) didn’t influence but an even bigger zone rests slightly
below the current level. The zone in question is defined by long term
trendline support along with the 2011 and 2013 lows (circled) at 1.2873
and 1.2744. These levels straddle the 61.8% retracement of the advance
from the 2012 low at 1.2787.
GBP/USD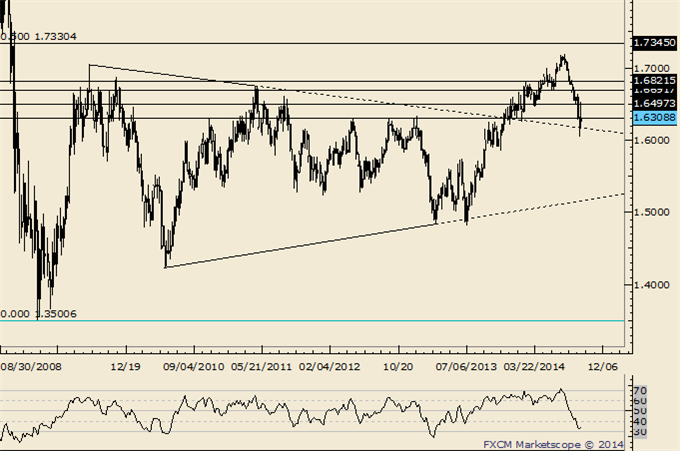
- “Of note is a weekly outside reversal and weekly RSI rolling over from above 70 this week. Prior instances of RSI rolling over (2004, 2006, and 2007) from above 70 indicated tops of at least several months. Major support comes in from the 3 peaks in 2012 and this year’s low at 1.6250-1.6340.”
- “Near term momentum (daily RSI) is at a level that has only been
reached several times in recent history, 2012 (one day) and 2008
(throughout August and September and once in October).”
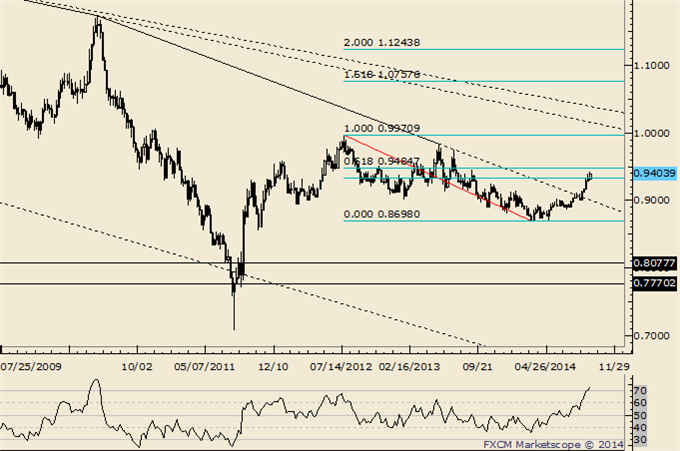
AUD/USD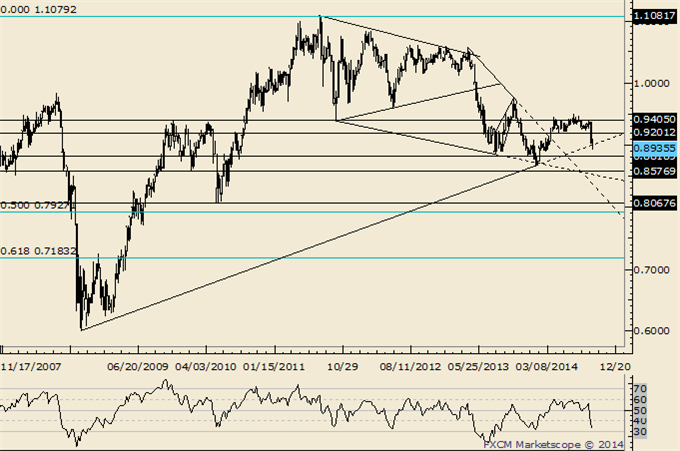
- “The combination of the .9400 figure and weekly RSI failing near 60 indicates a lot of overhead to punch through. Since the 2011 top, each RSI failure near 60 has led to a top or topping process (range for several weeks then a breakdown...that may be the case now).”
- AUDUSD broke down from a head and shoulders top on 9/9. The target was
reached 4 days after the pattern completed.
NZD/USD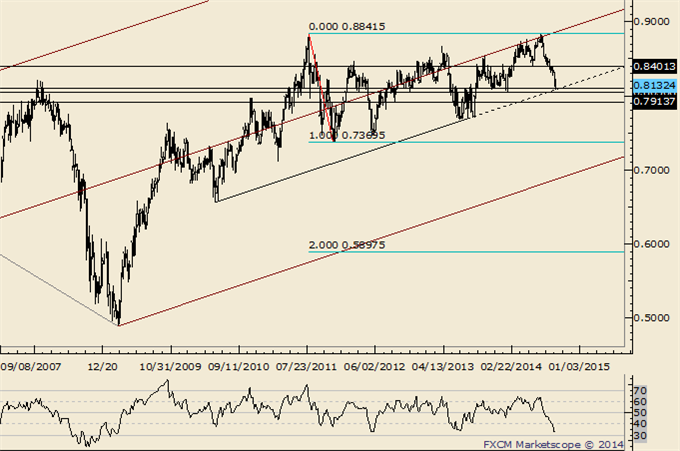
- “Don’t forget about the line that extends off of the 1996 and 2007 highs. That line crosses through the 2008, 2011, and highs as well. In 2011 (record free float high), the rate surged through the line in late July before topping on August 1st. The rate reversed this week from pips below the record high and above the mentioned line.”
- “Above .8534 is needed in order to suggest that at least a minor low is
in place. Look lower as long as price is below that level.”
USD/JPY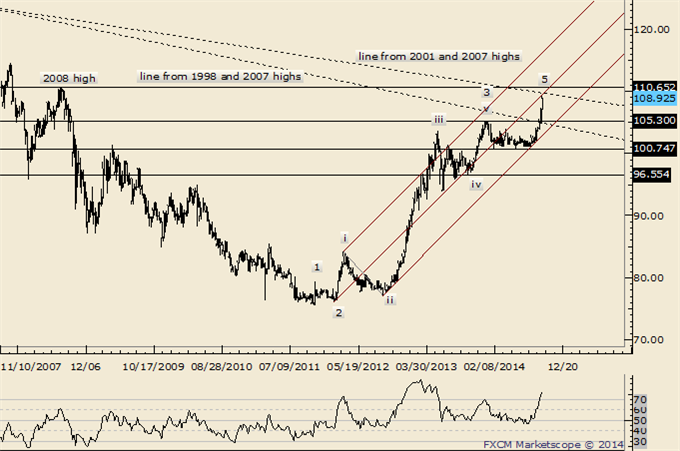
- “Treat wave 4 as complete as long as price is above 102.50 (103.00/30 is support). That means new highs in wave 5 (then risk of a major decline but don’t forget that ‘5ths’ can extend). 104.75 is a near term target.”
- “Focus is now on expansion targets at 108.33 and 110.12 as long as
price is above 103.50.”
USD/CAD
- "USDCAD has fallen apart which ironically means it is probably going to find some sort of low soon. The rate is nearing important price levels. The 2011 high at 1.0657 and current year open at 1.0634 are possible supports." The line that extends off of the 2012 and September 2013 lows is at about 1.0607 next week. This level is in line with the July 2013 high at 1.0608.” USDCAD ended up finding low at 1.0620.
- The USDCAD dip from 1.0997 found support at the 50% retracement of the
1.0620-1.0997 advance (the 61.8% is at 1.0764).
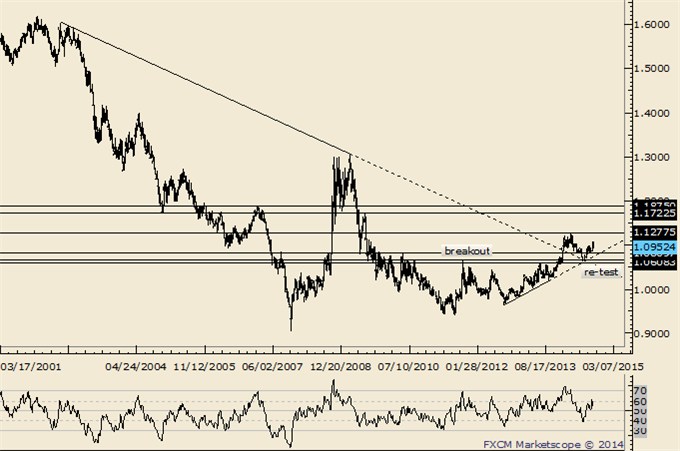
USD/CHF
- “There is a trendline that extends off of the 1985 and 2001 highs near .9400. The nearly 30 year trendline splits the 50% and 61.8% retracements of the decline from the 2012 high (.9335 and .9485).”


