

Though many precious metals bulls are starting to get excited again, gold and silver have had several temporary rallies that fizzled out since their peak in 2011. Is the current rally for real, or will it end in another disappointment? To answer that question, let’s take a look at the technical picture.
Earlier this month, gold cleared both its $1,250 resistance level and the diagonal downtrend resistance line, which are both support levels now. Gold is now underneath its $1,300 resistance level, which has some significance as a round psychological number that caused gold to bump its head two weeks ago. If gold decisively breaks $1,300, $1,400 is the next significant resistance level to watch. On the other hand, if gold cannot close above $1,300 and manages to fall back below the $1,250 support level, it may correct to even lower levels.

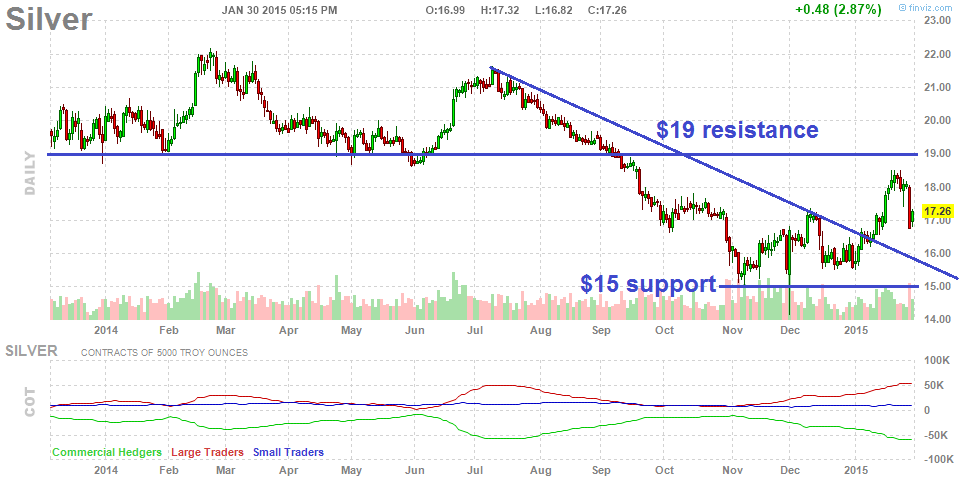
Silver recently broke above its diagonal downtrend resistance line, but is underneath its key $19 resistance level that was an important support level for much of 2013 and 2014 (this level will be discussed in more detail shortly). If silver can close above $19, it would be a bullish technical signal. If silver falls back to its $15 support level and breaks below it, however, the bear market is likely to continue.
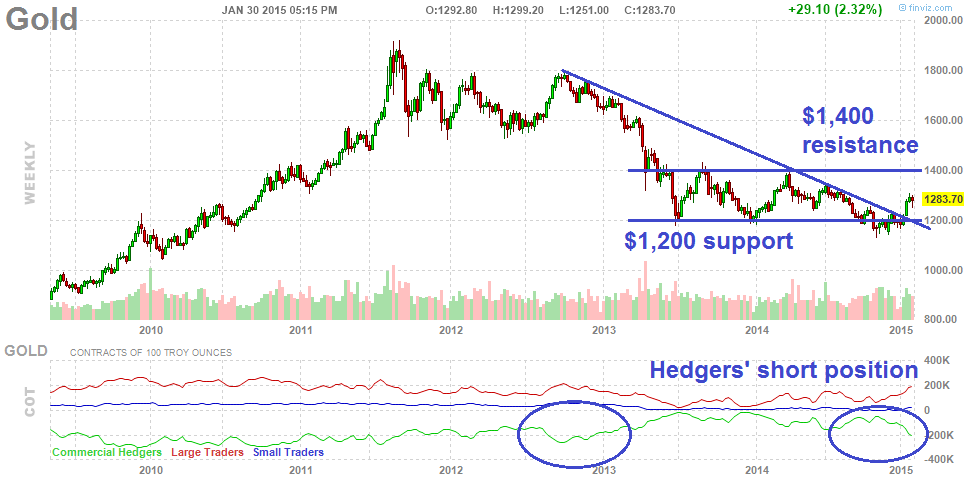
From a longer-term perspective, gold still remains within its trading range between $1,200 and $1,400. If gold has a solid breakdown under its $1,200 support, it could fall to $1,000 or even lower. If gold breaks back above $1,400, it may climb to its next major resistance level at $1,600 or even higher. Commercial futures hedgers (often considered the “smart money”) have accumulated a sizeable short position on gold in the past few months, which likely indicates their skepticism of the recent rally. The last time the commercial hedgers rapidly built a large short position was before gold peaked at $1,800 in late-2012 before it plunged to $1,200.
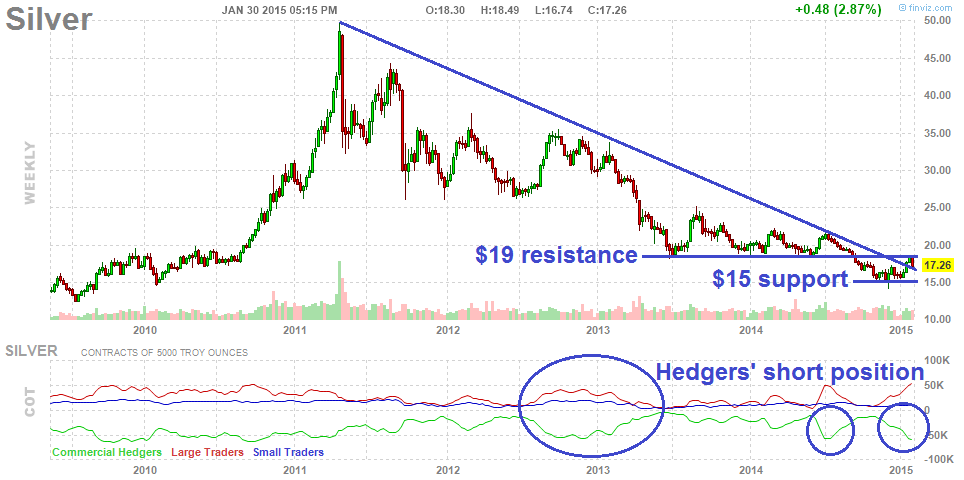
The longer-term silver chart shows how the metal is underneath its major $19 resistance level but above its $15 support level. As with gold, commercial silver futures hedgers have rapidly built a short position similar to how they did in late-2012 and mid-2014, which was before significant bearish moves.
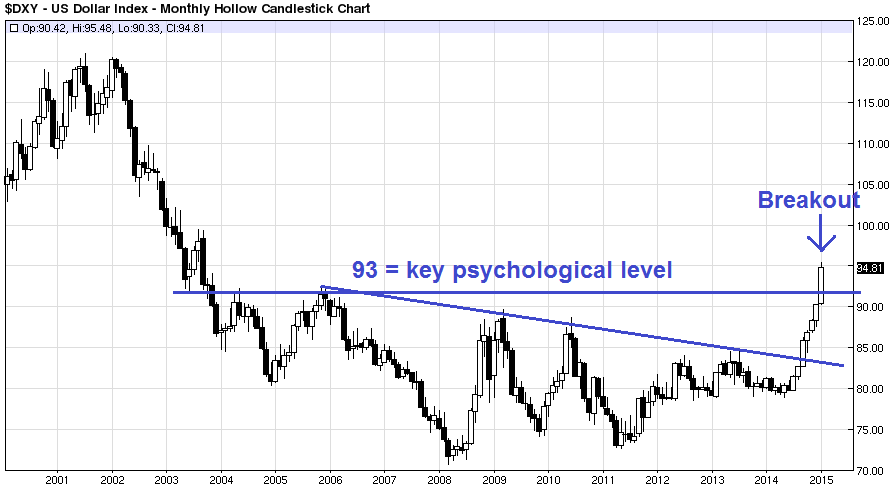
When analyzing precious metals and other commodities, it is helpful to monitor the U.S. dollar due to its inverse relationship with them. Bullish signals in the U.S. dollar are typically bearish signals for precious metals, and vice versa. After rallying for the past seven months, the U.S. Dollar Index recently broke above its key psychological level at 93. If the Dollar Index stays above this level, it may be a sign that a longer-term U.S. dollar bull market has started, which should have bearish implications for commodities and precious metals.


 & AMD Framework")