

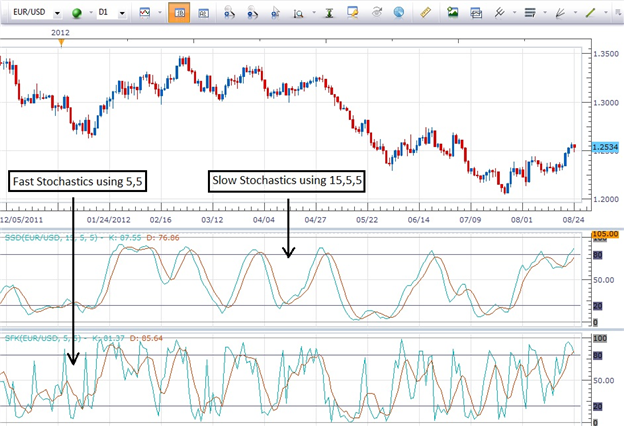
Stochastic is an oscillator that determines where the most recent closing price is relative to its price range over a given time period. It is one of the most popular oscillators that traders use in range-bound market.
The indicator involves two lines:
- %K
- %D which is a D-period moving average of %K
Where
- %K = 100 [ (C - Ln) / (Hn - Ln) ]
- C = latest close, Ln = lowest close over last n periods, Hn = highest high over last n periods
The most commonly used time period is 14, and the most common value for K and D are 5 and 3 respectively.
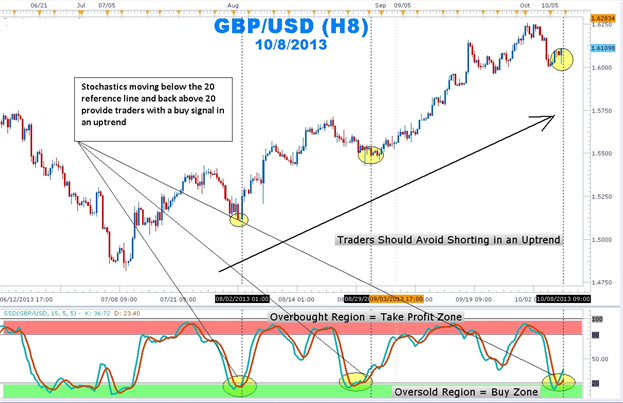
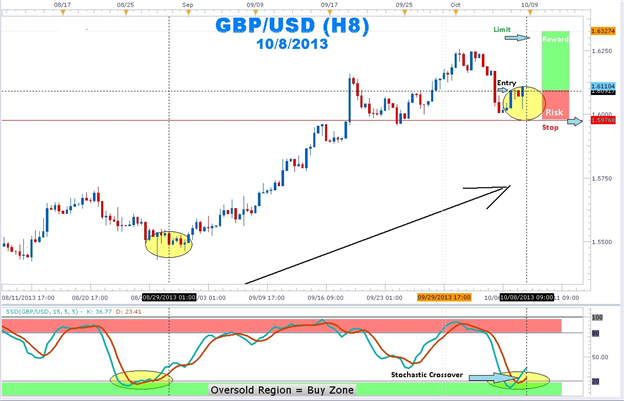
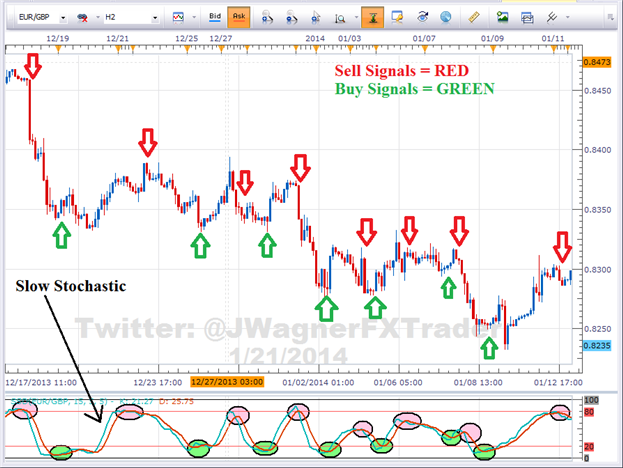
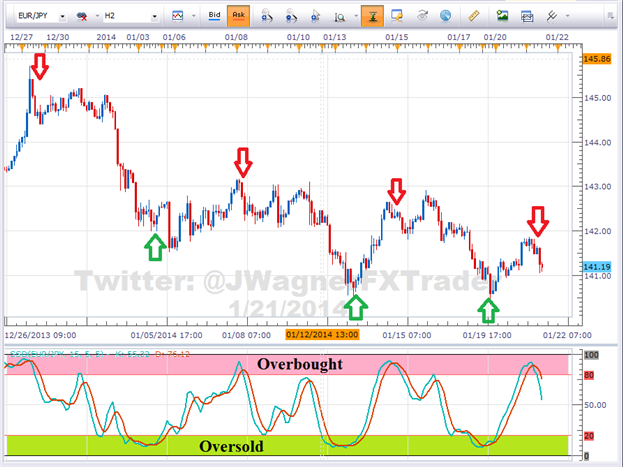
1. Detect overbought/oversold levels
When Stochastic is over 80, the pair is considered to be overbought. If
Stochastic is below 20, the pair is considered to be oversold.
2. Crossovers


")