

Following the bull market pattern of the past five years, the U.S. stock market continues to climb to new highs while shaking off all reasons for pessimism as well as the warnings of skeptics. Stock market bulls are becoming increasingly brazen as they drive the market to nosebleed heights, which is convincing a greater number of people into believing in the economic recovery. Unfortunately, the public is being fooled because the U.S. stock market and economy is experiencing another classic central bank-driven bubble that will end in a calamity, erasing trillions of dollars of wealth.
As you will see from the charts in this article, there is so much proof that the bull market is actually a dangerous speculative bubble that it is simply undeniable. Despite what the cold, hard facts show, legions of pundits, economists, and investors are coming out of the woodwork to deny the existence of what is one of the most obvious bubbles in history. This widespread denial is what happens when emotions trump logic and reasoning.
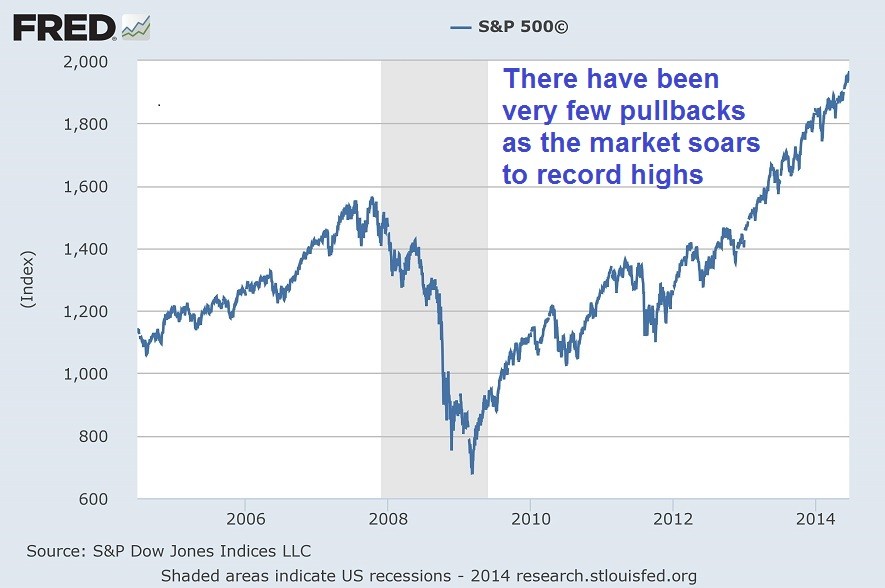
1) Since the current bull run started in early-2009, the stock market has tripled in value while barely experiencing any pullbacks aside from brief corrections in 2010 and 2011, when the Global Financial Crisis was still in full swing. The lack of meaningful pullbacks has emboldened bullish investors as market volatility and risk becomes a distant memory.
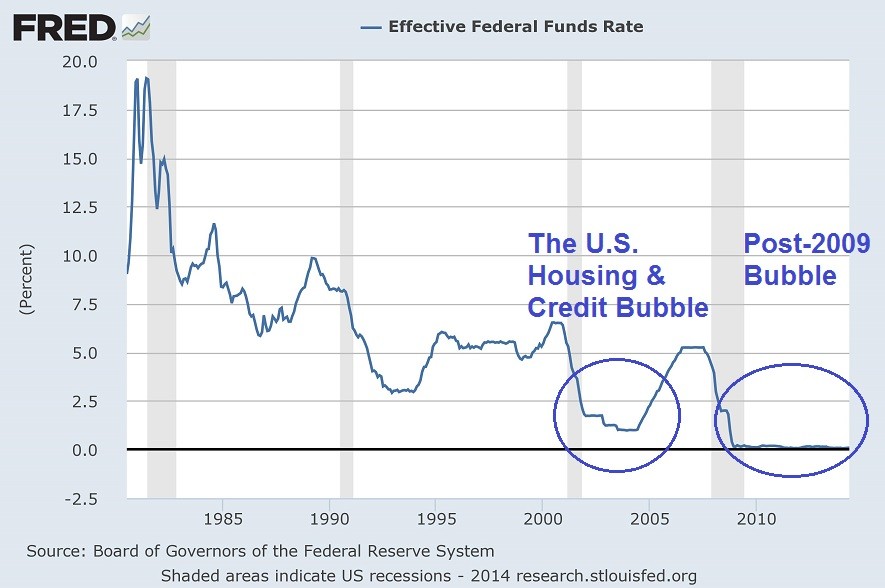
2) The latest bubbles in the U.S. stock market and economy are driven by record low interest rates that are a product of the Federal Reserve’s aggressive monetary stimulus policies since the financial crisis. Ultra-low interest rates lead to bubbles because borrowing costs are dramatically reduced, while saving is discouraged by the paltry returns on savings accounts and less risky fixed-income investments, which essentially forces otherwise conservative savers and investors into riskier and more volatile investments such as stocks. The disastrous U.S. housing and credit bubble inflated as a direct result of the last low interest rate period from 2002 to 2007; the situation is even more precarious now that the Fed Funds Rate has remained at virtually zero percent for over five years:
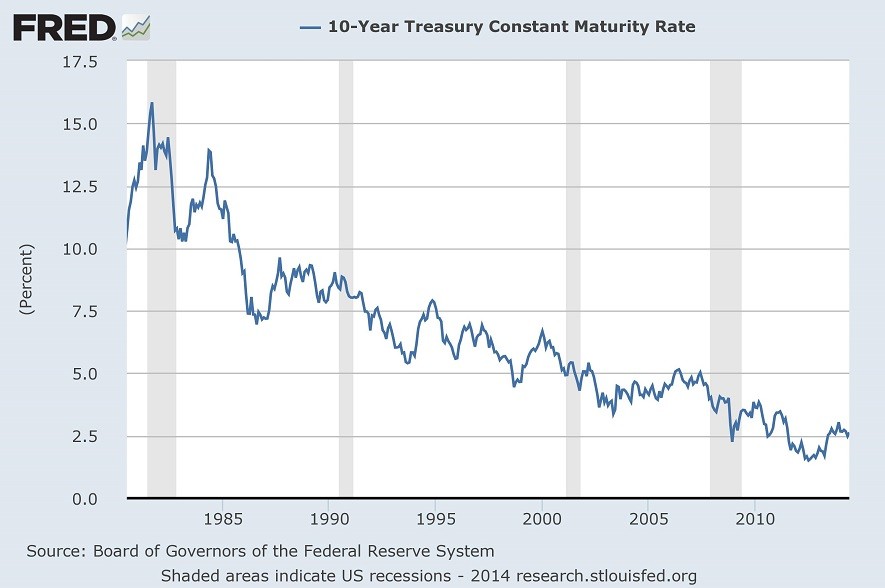
3) Longer-term interest rates such as the 10-year U.S. Treasury Note yield have also been at record lows since the financial crisis, which has greatly reduced mortgage borrowing costs and is driving another housing bubble in some locations and market segments, as well encouraging a corporate bond borrowing binge. Today’s extremely low bond yields are pushing investors into the stock market to earn returns that they would normally have earned from bonds.
4) Bond yields have been pushed to record lows by the Federal Reserve’s quantitative easing programs that are intended to pump liquidity into the financial system to boost the hard-hit U.S. economy. When running quantitative easing (QE) programs, the Fed creates new money out of thin air and uses it to purchase Treasury and mortgage bonds, which reduces the yields on those bonds. The chart below shows that the Federal Reserve has purchased nearly $3.6 trillion worth of bonds in the past half-decade. Each of the Fed’s three QE programs caused the stock market to surge as more liquidity was pumped into the financial system.

5) Record low borrowing costs and the soaring stock market has encouraged traders to aggressively use margin to finance their stock purchases, which is exactly what occurred during the Dot-com Bubble and the U.S. housing and credit bubble:
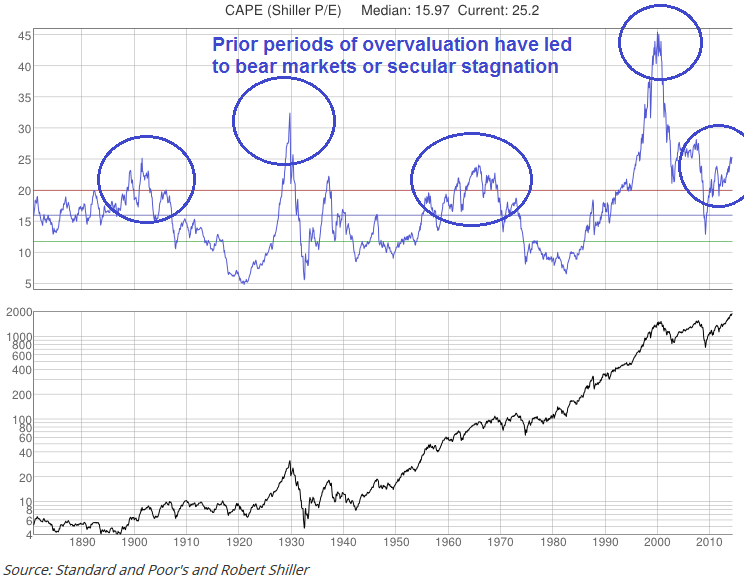
6) The Federal Reserve’s monetary stimulus policies of the past five years have reinflated the stock bubble, which is why nearly every valuation indicator shows that stocks are quite overvalued once again. When stock market valuations hit generational highs, secular bear markets or long periods of stagnation typically ensue. Note: the market valuation peaks of the early-1900s and late-1960s actually led to powerful bear markets when adjusted for inflation, even though the nominal value of the stock market remained stable for long periods of time. For example, the raging inflation of the 1970s eroded the value of stocks as the market stagnated for nearly fifteen years.
The chart below shows a valuation measure called the Shiller P/E Ratio, which is the price-to-earnings ratio based on average inflation-adjusted earnings from the previous 10 years:
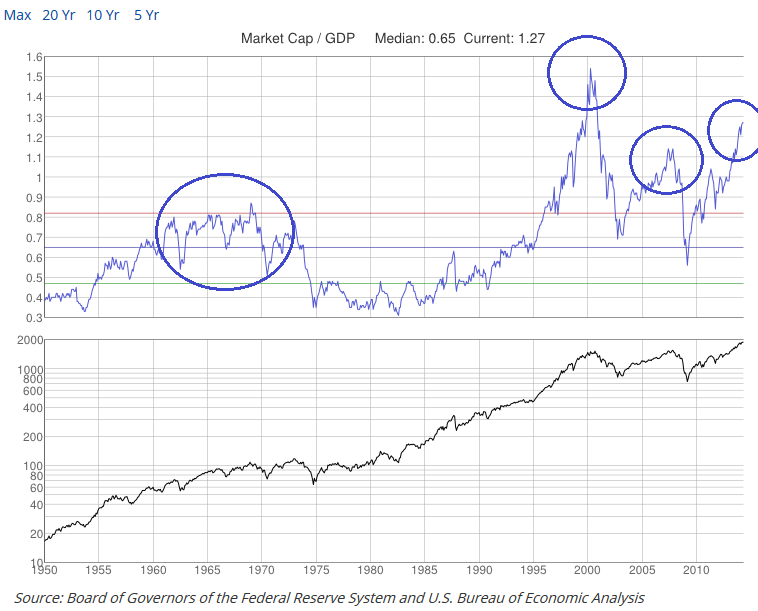
7) The total market capitalization to GDP ratio, which Warren Buffet described as “probably the best single measure of where valuations stand at any given moment”, also confirms that stocks are in bubble territory:
8) Another valuation indicator, Tobin’s Q Ratio (the ratio of the market’s price to replacement costs), shows that U.S. stocks are overvalued:

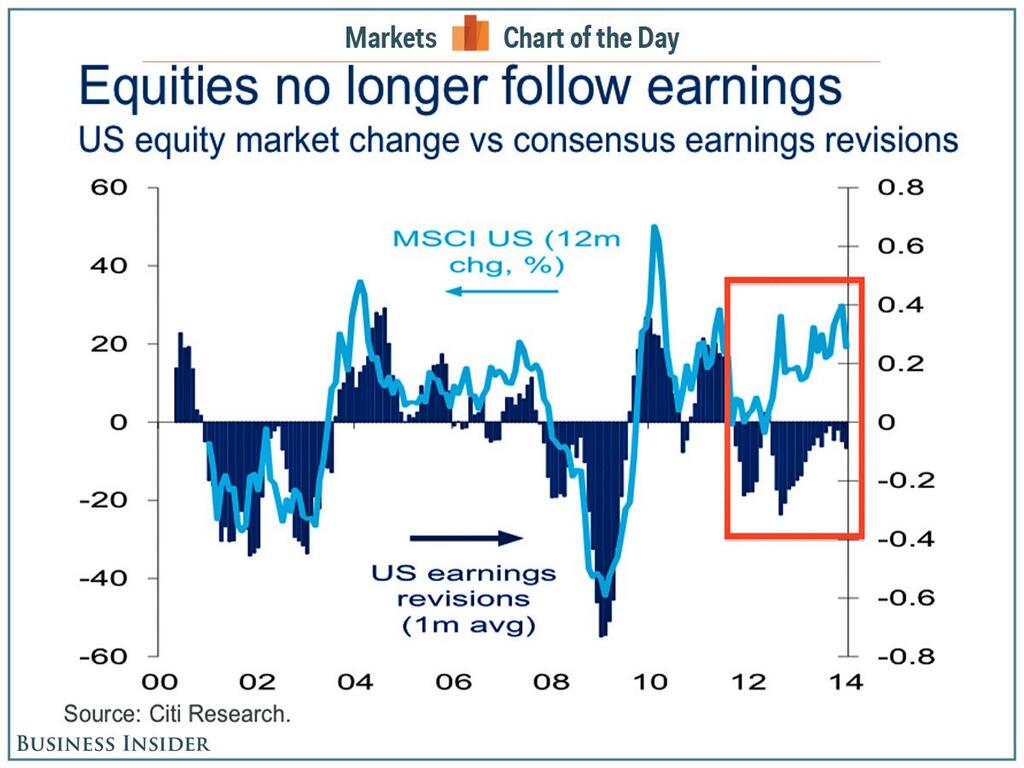
9) Stock markets become overvalued when stock prices rise at a much faster rate than earnings, which is what has occurred for the past several years:
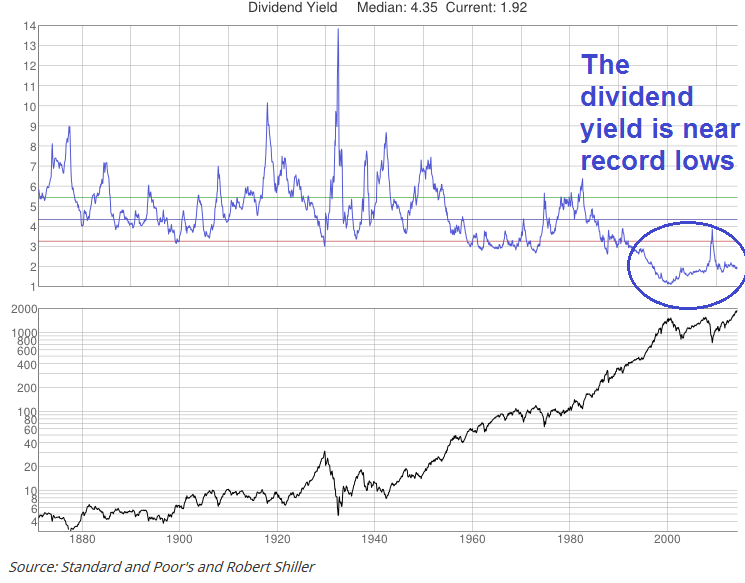
10) The market’s ultra-low dividend yield is even more proof that stocks have been in a longer-term “Bubble Era” since the late-1990s that never truly ended. The current low interest rate environment helps to suppress dividend yields by forcing investors out of once high-yielding investments (such as bonds) and into dividend-paying stocks, thereby inflating their values.
Most mainstream analysts believe that dividend yields have plunged since the 1990s primarily because of companies’ greater preference for reinvesting earnings instead of paying dividends, which is partly true, but it doesn’t fully explain why dividend yields are so low, especially when so many valuation measures show that the stock market is very inflated.
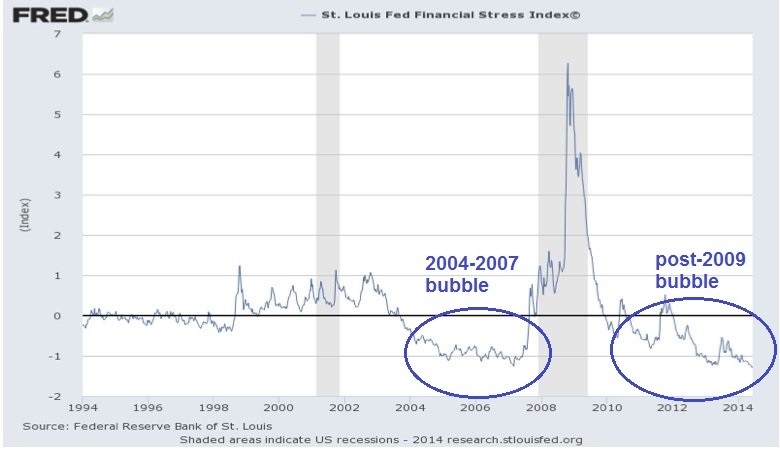
11) An indicator called the Financial Stress Index shows that investors are becoming downright euphoric and complacent just like they did during last decade’s bubble.


![[iVISTscalp5]: TSI — Timing Strength Index](https://c.mql5.com/6/1015/splash-preview-772243.png "[iVISTscalp5]: TSI — Timing Strength Index")
![[XAUUSD]: Weekly Liquidity Activation Points (LAP), July 6 - July 10, 2026](https://c.mql5.com/6/1015/splash-preview-772241.png "[XAUUSD]: Weekly Liquidity Activation Points (LAP), July 6 - July 10, 2026")
