
Technical Analysis for Gold, Crude Oil, US Dollar and S&P 500 - US Dollar Opens 2015 With Largest Advance in Three Weeks

US DOLLAR TECHNICAL ANALYSIS
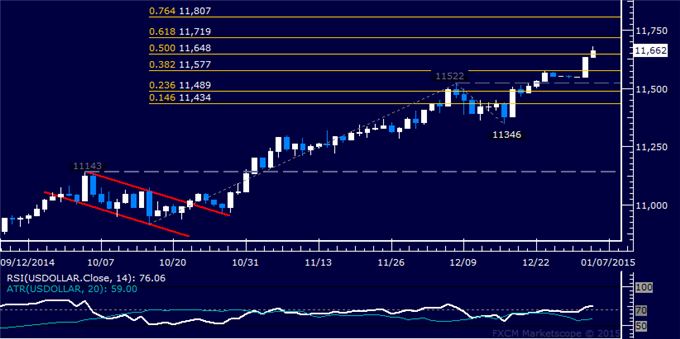
Prices are attempting to continue
building higher having started 2015 off with the largest daily rally in
three weeks. A daily close above the 50% Fibonacci expansionat 11648
exposes the 61.8% level at 11719.
S&P 500 TECHNICAL ANALYSIS
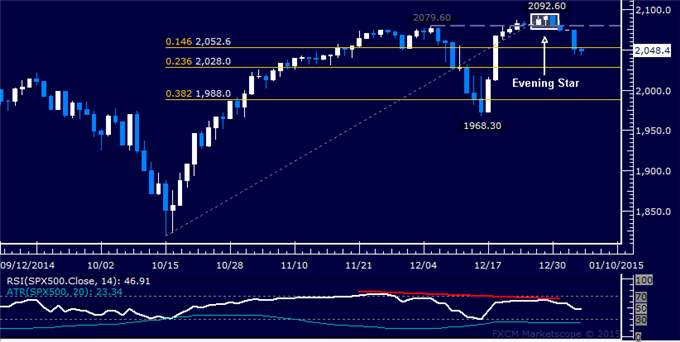
Prices turned lower as expected
after putting in a bearish Evening Star candlestick pattern. Sellers now
aim to challenge the 23.6% Fibonacci retracement at 2028.00, with a
break below that on a daily closing basis exposing the 38.2% level at
1988.00. Alternatively, a reversal back above the 14.6% Fib at 2052.60
aims for the December 5 high at 2079.60.
GOLD TECHNICAL ANALYSIS
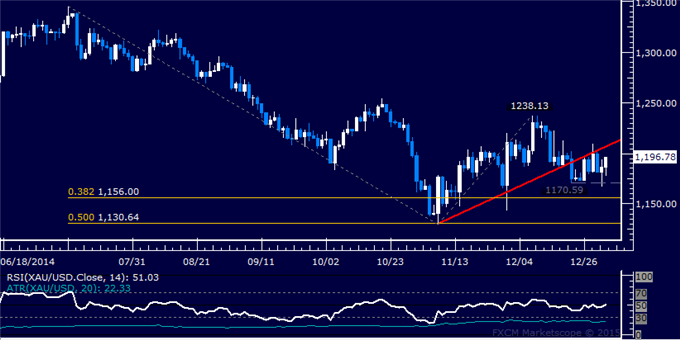
Prices continue to consolidate above
the December 22 low at 1170.59. A break below that on a daily closing
basis exposes the 38.2% Fibonacci expansion at 1156.00.
CRUDE OIL TECHNICAL ANALYSIS
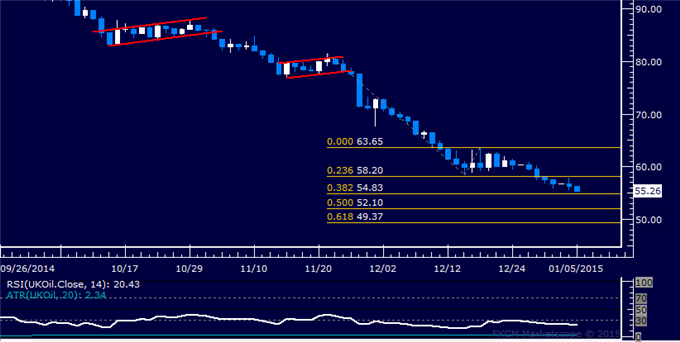
Prices are aiming to extend losses
after breaking support at 58.20, the 23.6% Fibonacci expansion. Sellers
now aim to challenge the 38.2% level at 54.83, with a further push
beneath that targeting the 50% Fib at 52.10.


")