Technical Price Pattern Analysis for US Dollar, S&P 500, Gold and Grude Oil: S&P 500 at Record High, US Dollar Continues to Rise

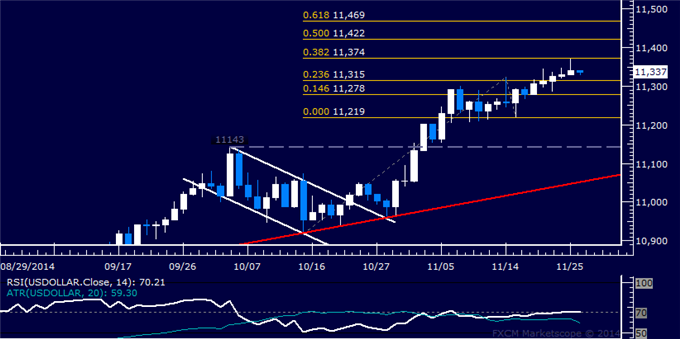
US DOLLAR TECHNICAL ANALYSIS
Prices continue to push higher,
advancing to set a new five-year high. A daily close above the 38.2%
Fibonacci expansion at 11374 exposes the 50% level at 11422.
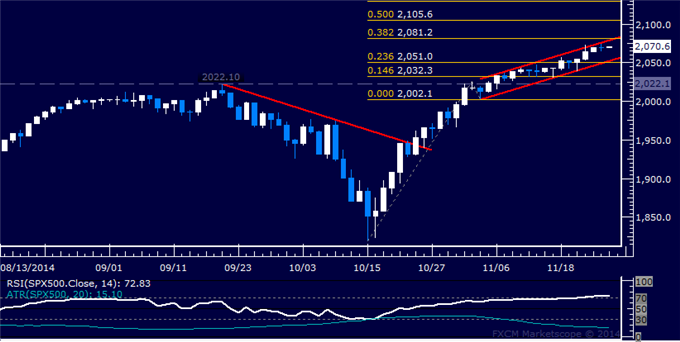
S&P 500 TECHNICAL ANALYSIS
Prices stalled after setting yet
another record high, snapping a three-day winning streak. A daily close
above the 38.2% Fibonacci expansion at 2081.20 exposes the 50% level at
2105.60.
GOLD TECHNICAL ANALYSIS
Prices are carving out a bearish Rising
Wedge chart formation, hinting a move lower may be ahead. A daily close
below the pattern’s floor at 1196.21 exposes the 1178.86-80.84 area
(December 2013 low, 23.6% Fibonacci retracement).

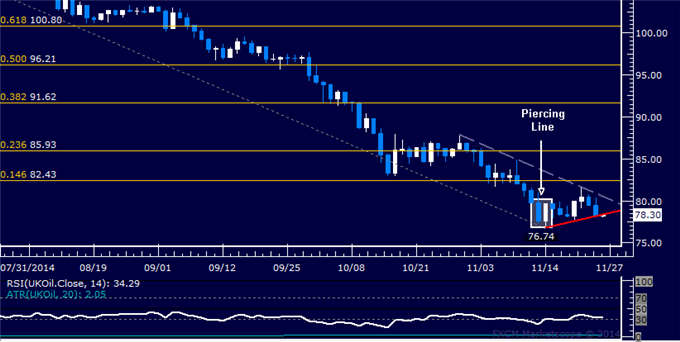
CRUDE OIL TECHNICAL ANALYSIS
Prices are struggling with
follow-through having attempted a recovery as expected following the
appearance of a bullish Piercing Line candlestick pattern. A daily close
below rising trend line support at 78.38 exposes the November 14 low at
76.74.