Trend lines are lines drawn on the historical price levels that predict general direction of where the marking is heading and provide indication of support/resistance.
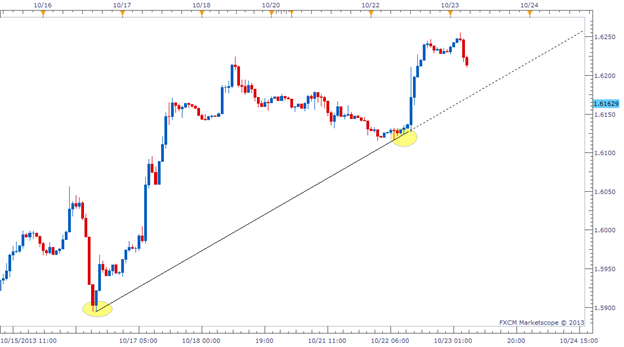
Drawing trend lines is a highly subjective matter. The best test of whether a trend line is a valid one is usually whether it looks like a good line. In an up trend, a trend line should connect the relative low points on the chart. A line connecting the lows in a longer-term rally will be a support line that can provide a floor for partial retracements. The down trend line that connects the relative highs on the chart will similarly act as resistance to shorter moves back higher.
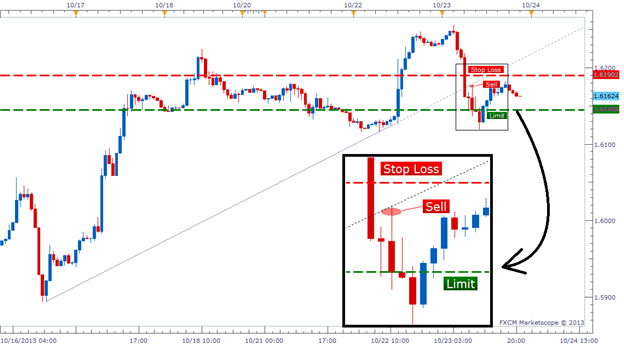
Any two relative highs or lows will be on the same line, so it is possible to draw a tentative trend line between any two points. Traders can use tentative trend lines as an indication of where support or resistance might be, but until a tentative line holds as support or resistance, it is not yet confirmed as valid.
Of course, the more times a trend line holds, the stronger it will be in the future. If a single line can connect 4 or 5 relative lows, then the chances of the next pullback bouncing off the line are high.