Technical Pattern Analysis for US Dollar, S&P 500, Gold and Grude Oil

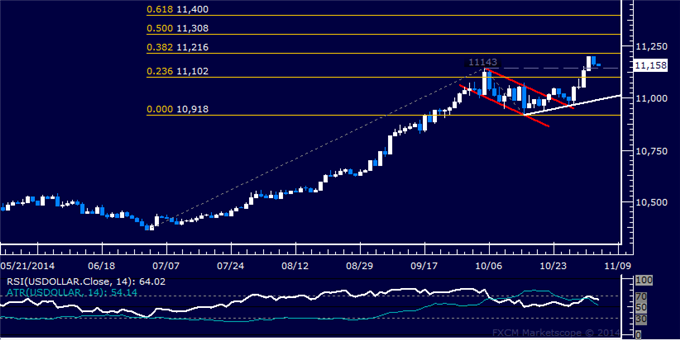
US DOLLAR TECHNICAL ANALYSIS
Prices corrected downward after
piercing October’s high to hit the strongest level in over four years.
Near-term resistance is at 11216, the 38.2% Fibonacci expansion, with a
break above that on a daily closing basis exposing the 50% level at
11308. Alternatively, a reversal below the 11102-43 area marked by the
October 3 high and the 23.6% Fib opens the door for a challenge of trend
line support at 10993.
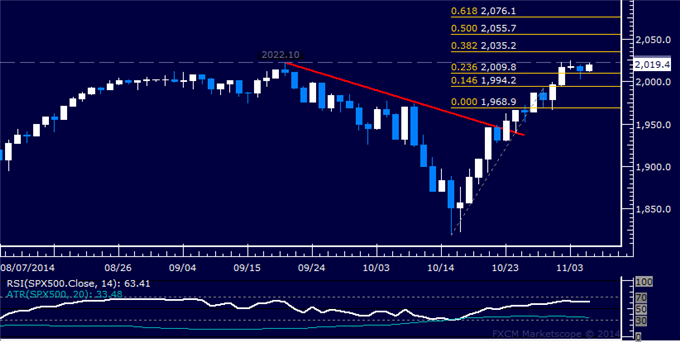
S&P 500 TECHNICAL ANALYSIS
Prices have returned to test
resistance at 2022.10, the September swing high, with a break above that
on a daily closing basis exposing the 38.2% Fibonacci expansion at
2035.20. Alternatively, a reversal below the 23.6% level at 2009.80 aims
for the 14.6% Fib at 1994.20.
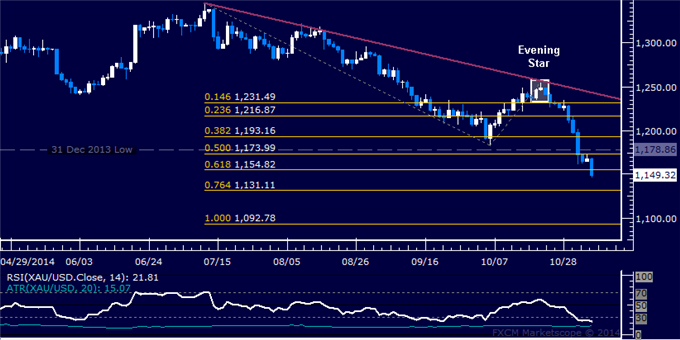
GOLD TECHNICAL ANALYSIS
Prices turned lower as expected after
putting in a bearish Evening Star candlestick pattern. A daily close
below the 61.8% Fibonacci expansion at 1154.82 exposes the 76.4% level
at 1131.11. Alternatively, a reversal back above the 1173.99-78.86 area
(December 2013 low, 50% Fib) aims for the 38.2% expansion at 1193.16.
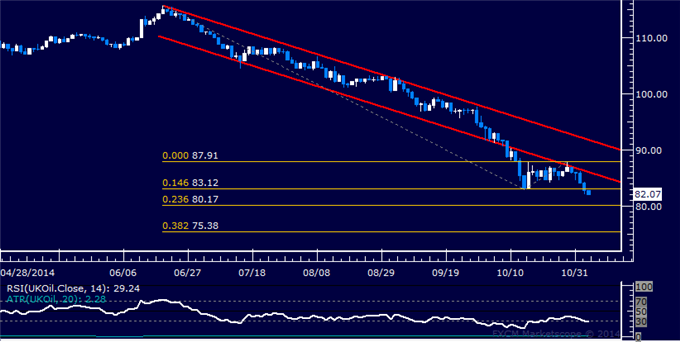
CRUDE OIL TECHNICAL ANALYSIS
Prices are back under pressure,
with a breach below the 14.6% Fibonacci expansion at 83.12 exposing the
23.6% level at 80.17. A further move below that aims for the 38.2% Fib
at 75.38. Alternatively, a reversal back above 83.12 targets falling
channel floor support-turned-resistance at 86.05.