

- This article is a capstone on the topic of support and resistance.
- Below we discuss multiple subjects within the field of support and resistance, many of which offer more detailed information by clicking on the relevant link.
Before we can use support and resistance in our trading, we have to know how to first find it, right?
This is where support and resistance identification comes in; and what makes this rather difficult for most traders is that there are a lot of ways to do it.
If a trader learns to use, let’s say pivot points; and keeps those pivot points on their charts expecting support or resistance to come in at these levels when market prices move there; they may be disappointed to find the market ignoring that level and instead looking at a more-relevant level from a Fibonacci retracement or psychological number.
So, rather than trying to learn the ‘best’ way to identify support and resistance levels – traders are best served by learning as many forms of this analysis as they can so that they can look at all of them as ‘areas of interest,’ to get trade ideas and setups.
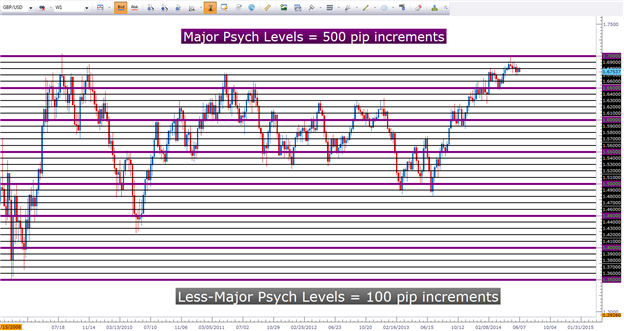
The easiest type of support and resistance analysis is often considered to be ‘Static’ Support and Resistance in the Forex Market. These are levels that are objective and non-negotiable, so it makes it really easy for new traders to learn how to identify these prices because it’s as simple as adding an indicator, or drawing a line on the chart.
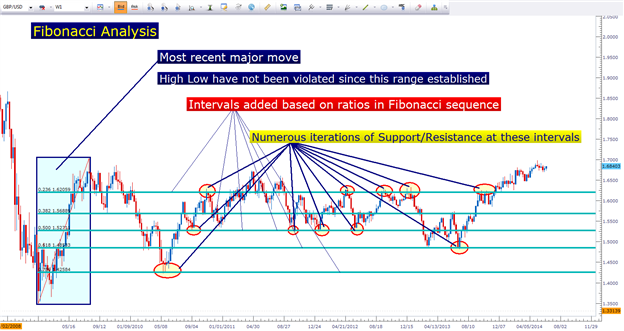
More complex support and resistance analysis can be found with Fibonacci studies.
With Fibonacci analysis, traders can examine a recent ‘major move’ in a market to see potential levels of future support or resistance. The levels looked at are ratios derived from the mathematical Fibonacci sequence, and can potentially have a massive bearing on longer-term price movements.
Validating Support and Resistance
But after we’ve identified support and resistance levels, we need to be
able to ascertain which of these prices may be relevant in the future.
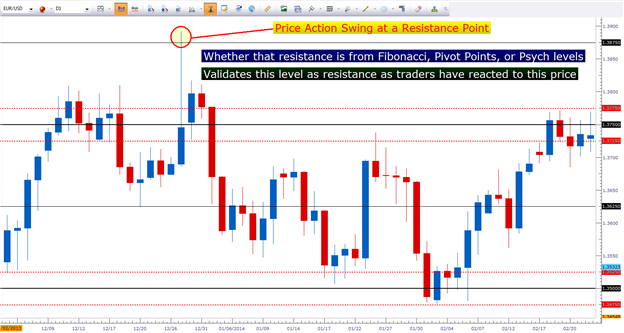
This is where price action comes into play, and traders can use this
type of analysis to locate price action swings in the market to see the
prices that traders had reacted to in the past.
After all, the chart is a depiction of supply and demand at any one
point-in-time… so by noticing the exact price level with which prices
reversed or reacted, traders can see the exact price level with which
that supply/demand scenario had changed.
Price action swings can not only show us additional levels of support and resistance – but they can help us validate price levels from other support and resistance methods by showing us where traders had reacted in the past.
Using Support and Resistance
This is the important stuff: Because what good is support and resistance if it doesn’t/isn’t bringing value to your approach?
This is the reason that support and resistance analysis is so utterly
important – it has numerous applications to a trader’s approach or
strategy.
In the opinion of many professionals – risk management is the most
important part of trading. To make this rationale as simple as possible –
no human being will ever be able to tell the future… so every trader is
going to be wrong at least some of the time. And as long as the risk is
out there that one time being wrong can wipe away the gains from 10 or
20 winners, the trader is likely looking at negative long-term expected
value.
Because what happens when you lose 3 or 4 trades in a row? Eventually you’ll have no capital left, all over 3 or 4 incorrect trade idea.
The reason support and resistance is so utterly important with risk
management is because of the most basic price action relationship that
observes that up-trending markets will often make series of
‘higher-highs’ and ‘higher lows’ and down-trending markets will be
accented with ‘lower-lows’ and ‘lower-highs.’
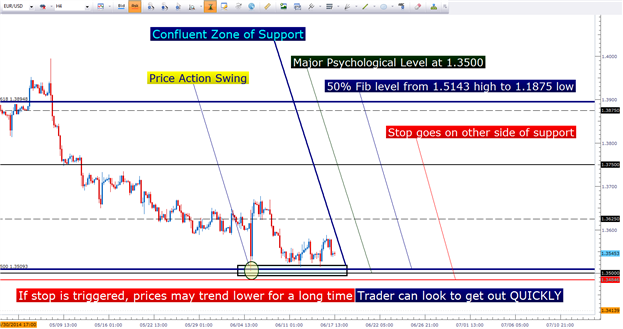
So, if you’re buying and looking for prices to move up – it’s logical to
place your stop underneath support. Because if prices break support
(thereby making a new low) – it may go on to break more support levels
(and make even ‘lower-lows’).
So, why would you want to stay in a long position in a down-trending
market? Even if you think prices are going to trend higher eventually –
you can stop the trade out at support and re-enter after a lower support
level is made as prices begin trending higher.
This would be using price action analysis to enter trades based on
support and resistance, and this brings up the next usage of support and
resistance analysis in the entry of trading positions.
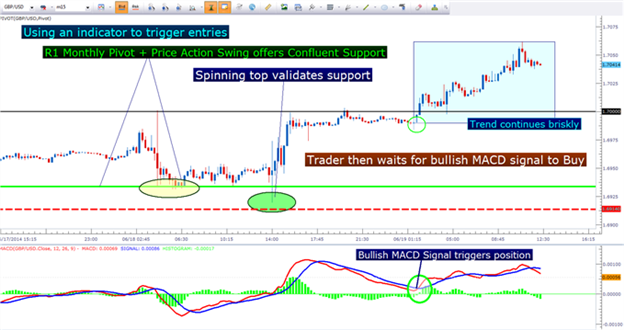
We discussed two different manners of entry in the article: Price action, as alluded to previously; and indicator-based entries. This would be like observing a strong level of support in a market, but waiting for an indicator signal to appropriately trigger a position in that direction. This can be done with numerous indicators such as RSI, MACD, CCI, Stochastics, and moving averages. This way, the trader can still use support and resistance in the risk management of their strategy and can continue to look to avoid trading mistake; and still rely on the simplicity of an indicator to decide when to buy and when to sell.
After the trade is initiated, the trader’s job is to then to
appropriately manage the position and once again, support and resistance
can provide value. And this is a field that most professional traders
will spend their careers attempting to master. Because just like we
can’t tell the future before we enter a trade, being long or short isn’t
going to help us do so any better.
So even after the trade is triggered, the trader’s job is to navigate a certain approach in an uncertain environment.
This is why trade management tactics such as the break-even stop can
be such a huge part of a trader’s approach. It allows them to move their
stop up to their original entry price so that, worst-case scenario, if
prices reverse the trader can avoid losing any of their precious risk
capital on the position. And if prices do continue, the trader can look
to reap even more gains and even bigger profits.
But we can’t just move our stops to break-even and hope for the best,
right? To make profits in markets we have to close our positions at some
point; but the big question is ‘when?’
Well – you’re never going to be able to perfectly forecast the future,
and the very act of you having a position has a strong tendency to taint
your analysis by having a bias. Too often new traders will quickly
close out winners for fear of prices turning around against them; while
they’ll also usually keep losing trades open far too long in the hope
that prices will move towards profitability.
This is pretty much the opposite of what most professionals look to do
by cutting their losses quickly, and letting their winners run.
But as we explained, traders can look to ‘scale out’ of positions so
that they can realize some profits in winning positions while still
keeping a portion of the position running. Support and resistance can
help in this approach because traders can use these levels to
continually manage risk, initiate entries, and adjust stops at and
around these price levels.


 Trading Guide")
