

This is a no brainer. Identifying support and resistance levels is one of the first things you learn in technical analysis. It is the most important aspect of chart reading. But, how many traders really pay attention to it? Not many. Most are too busy looking at Stochastics, MACD, and other nonsense.
Tip #2. Analyze swing points
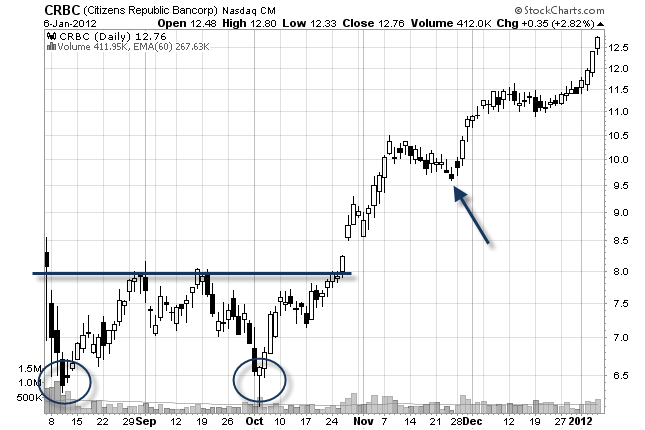
Swing points (some call them "pivot points") are those areas on a stock chart where important short term reversals take place. But not all swing points are created equal. If fact, your decision to buy a pullback will depend upon the prior swing point. Here is an example:

Look at the area that I have highlighted in green. You may have
considered buying this pullback. Now look at the prior swing point high
(yellow highlighted). There are two problems with buying this pullback.
First, there isn't much room to work with! The distance between the
pullback and the prior high is too small. You need more room to run so
that you can at least get your stop to break even.
Tip #3. Look for wide range candles
Wide range candles mark important changes in sentiment on every chart - in every time frame.
Tip #4. Narrow range candles lead to explosive moves
Narrow range candles can also tell you that a reversal is imminent. This low volatility environment can lead to explosive moves.
Tip #5. Find rejected price levels
On candlestick charts, lower or upper shadows on candles usually means
that there is a hammer candlestick pattern or a shooting star
candlestick pattern (if the shadow is long enough).
Tip #6. Learn the 50% rule
How can you tell if a candle is significant? Easy. Look to see how far
it has moved into the prior days range. If it moves at least 50% into
the prior days range, then it is significant. And, it is especially
significant if it closes at least 50% into the prior days range. This
usually shows up on the stock chart as a piercing candlestick pattern or
an engulfing candlestick pattern.
Here is an example:
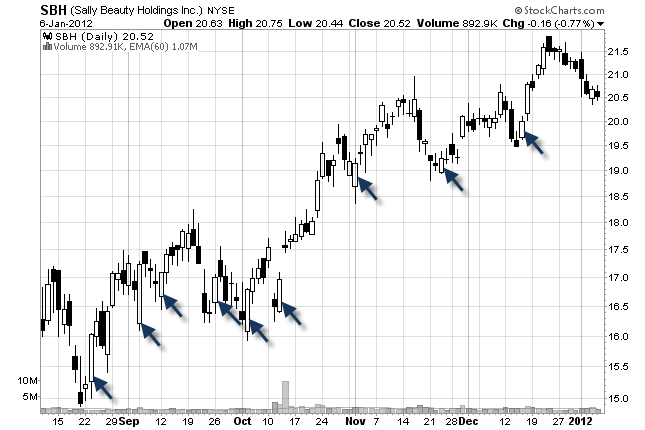
All of the important reversals in this stock happened only after a
candle moved at least 50% into the prior days range (some moved much
more than 50%).
Tip #7. The gap and trap price pattern
Tip #8. Measure the depth of a swing
Tip #9. Consecutive up days and consecutive down days
Stocks will reverse direction after consecutive up days or down days. So, it pays to keep this in mind when you are looking to buy or short a stock. Here is an example:

Tip #10. Location of price in a trend
So, there you have it. These price action tips and tricks will make you money in the stock market.


