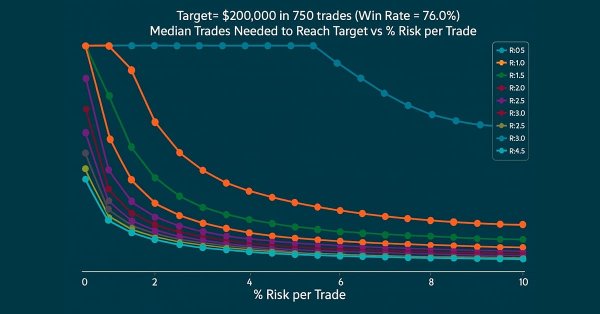
Building a Trading System (Part 3): Determining Minimum Risk Levels for Realistic Profit Targets
Introduction
Every trader's ultimate goal is profitability, which is why many set specific profit targets to achieve within a defined trading period.
In Part 2 of this series, we demonstrated how to utilize position sizing in systems with a positive expectancy to accelerate account growth. Our findings indicated that for a system with both a high win-rate and a reward-to-risk ratio (RRR) exceeding its minimum threshold, it is possible to risk more than the conventional 2% of account balance without compromising long-term viability. This raises an important question: What is the minimum risk percentage per trade (risk %) required to achieve a profit target within a given period?
In this article, we employ Monte Carlo simulation to identify the minimum risk % necessary to meet a predefined profit target. We also analyze the associated drawdowns and the potential number of consecutive losses for a given win-rate. These insights will help determine whether a target is realistically achievable or overly ambitious, and guide traders on which parameters to adjust to set attainable and sustainable trading objectives.
Key Objectives of This Analysis:
- Determine the minimum risk % required to hit a profit target within a set timeframe.
- Evaluate the drawdown and consecutive losses associated with the chosen risk level.
- Assess the feasibility of the profit target—whether it is achievable or requires adjustments.
- Identify which parameters can be optimized for better results.
By the end of this exploration, traders will have a clearer understanding of how to structure their risk management strategies to meet their financial objectives efficiently.
Stay tuned as we dive into Monte Carlo simulations and uncover actionable insights for optimizing trading performance.
Expected Growth Factor
To determine the minimum risk % required to achieve a profit target, we first need to establish the Expected Growth Factor (Ef), a key metric in compounding returns. As discussed in Part 2 of this series, risking a fixed percentage of the current account balance often results in faster account growth compared to risking the same percentage of the initial balance. Therefore, for this study, we will adopt the risk % of current balance approach.
The formula for account balance evolution is as follows:
At each trade j:
- If trade is a win:
![]()
- If trade is a loss:
![]()
Combining both cases:
![]()
Where:
- f = fraction of account risked per trade
- Balance _j − 1 = previous balance
- Balance _j = current balance
- P = win-rate
Factoring Balance _j−1 out:
![]()
We define the Expected Growth Factor (Ef) as:
![]()
From compound growth, we also have:

Where:
- n = number of trades
- Ptarget = profit target
- balance_i = initial balance
By combining Equations (2) and (3), we can solve for the minimum risk % required to achieve a given profit target over a specific number of trades.
Case Study
We examine three systems with identical RRR = 2.6 but different win-rates: 30%, 45%, and 76%. The trader starts with an initial balance of $1,000, aims for a profit target of $200,000, and trades 700 times.
From Equation (3):

Case 1: Win-rate = 30%
From Equation (2):

Case 2: Win-rate = 45%
![]()
Case 3: Win-rate = 76%
![]()
Observation
With a fixed RRR, a higher win-rate significantly reduces the required risk %. For example:
- At 30% win-rate, risking 9.5% per trade is extremely aggressive and could easily lead to account ruin.
- Given a 45% win-rate, only 1.5% risk per trade is needed to meet the same target and is acceptable for risk management.
- With a 76% win-rate, a conservative 0.4% risk per trade is ideal, ensuring steady growth with minimal drawdowns.
Adjusting Parameters
Increasing Number of TradesIf the 30%-win-rate trader increases trades from 700 to 900, then:

Required risk reduces to 7.4%, which is still high but better than 9.5%.
Reducing Profit Target
If the 30%-win-rate trader increases trades from 700 to 900, then:

Required risk reduces to 7.4%, which is still high but better than 9.5%.
Reducing Profit Target
If the trader drops the profit target to $120,000 over 700 trades,
![]()
Required risk reduces to 8.6%, still high but an improvement over 9.5%.
Increasing Risk for High Win-Rate Systems
For a 76% win-rate system, the required 0.4% risk is highly conservative. By reducing trades to 300,
![]()
Required risk increases to 1%, which remains within professional guidelines and achieves the target in fewer trades.
Key Insight
Different win-rate and RRR combinations require tailored risk management to achieve specific profit targets. Traders must understand their system’s statistical characteristics and set realistic, achievable goals rather than arbitrary targets.
Monte Carlo Simulation Scenarios
To refine our approach, we run Monte Carlo simulations, testing different risk % and RRRs for various win-rates. This helps us determine:
- Success Rate – Probability of hitting the profit target.
- Optimal RRR & Risk % – Best combination for a given win-rate.
- Drawdown & Consecutive Losses – Risk exposure under different scenarios.
- Trades Needed – Minimum trades required to reach the goal.
This simulation-based approach equips traders with data-driven insights for strategic decision-making.
Scenario 1: 30% Win-Rate — Profit Target of $200,000, Initial Balance of $1,000, 750 TradesFigure 1 presents the simulation results for a 30% win-rate system across varying RRR and risk %. The vertical axis represents the risk % (ranging from 0.5% to 10%), while the horizontal axis represents the RRR (ranging from 0.5 to 5). The color scale indicates the probability of achieving the profit target; pale yellow corresponds to a 0% success rate, and deep blue corresponds to 100%.
For this scenario, we define the minimum risk % as the smallest risk value that yields a success rate above 50%.
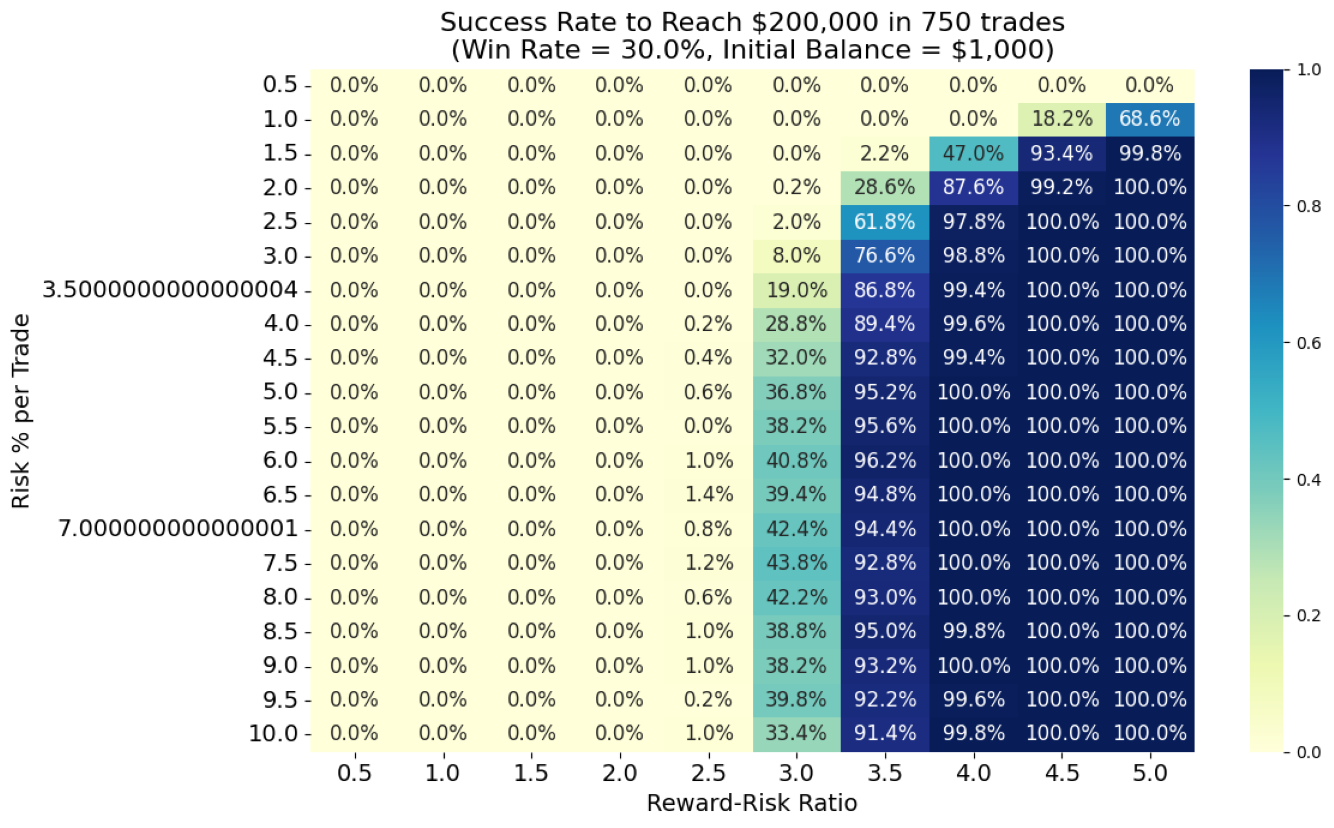
Figure 1: 30% win-rate system
For a 30% win-rate, by observing the chart:
- To achieve the profit target at a 30% win-rate, the minimum viable combination is RRR = 3.5 and risk = 2.5%.
- Increasing the RRR to 4.0 allows the trader to reduce the risk to 2.0% and still reach the target within 750 trades.
- With such a low win-rate, the trader must be prepared for extended drawdown periods and maintain strong psychological discipline.
- Importantly, the minimum risk % required here exceeds the conventional 2% risk management guideline.
- Traders adhering strictly to the 2% rule would need to either increase the trade count or lower the profit target to make the goal more realistic.
Table 1: Top 5 combinations with minimum success rate > 50% for 30% win-rate system.
| RRR | Risk % | Success Rate % | Median Final Balance | Median Max Drawdown % | Median Max Consecutive Losses |
|---|---|---|---|---|---|
| 3.50 | 2.50% | 61.8% | $296,096.00 | 42.88% | 16 |
| 5.00 | 1.00% | 68.6% | $282,173.00 | 15.83% | 15 |
| 3.50 | 3.00% | 76.6% | $568,961.00 | 49.78% | 16 |
| 3.50 | 3.50% | 86.8% | $1,715,644.00 | 56.01% | 16 |
| 4.00 | 2.00% | 87.6% | $820,417.00 | 32.40% | 16 |
Observations & Analysis
Replace "by eye" with a reproducible rule (e.g., >50% successful runs), then show how the thresholds were determined and provide the resulting Table 1.
1. Success Rate – Probability of Hitting the Profit Target- Higher RRR allows lower risk % while maintaining success.
- At RRR=5.0 & Risk=1.0%, the success rate is 68.6%, proving that a high reward ratio compensates for low risk.
- At RRR=4.0 & Risk=2.0%, the success rate jumps to 87.6%, making this the most reliable combination.
- Increasing risk % improves success but also amplifies drawdowns.
- Moving from 2.5% to 3.5% risk (at RRR=3.5) increases success from 61.8% to 86.8%, but drawdown spikes from 42.88% to 56.01%.
2. Optimal RRR & Risk % – Best Trade-Off for 30% Win-Rate
- Best Balance (High Success + Manageable Risk):
- With an RRR of 4.0 and a risk level of 2.0%, the model recorded an 87.6% success rate alongside a 32.4% maximum drawdown, indicating the most favorable balance observed.
- Most Conservative (Lowest Risk):
- Using RRR of 5.0 and a 1.0% risk allocation, the model produced a 68.6% success rate and a maximum drawdown of 15.83%, representing the most risk-averse configuration, albeit with reduced growth potential.
- Aggressive (Highest Growth Potential):
- Maintaining RRR of 3.5 and a risk level of 3.5%, the model yielded an 86.8% success rate accompanied by a 56.01% maximum drawdown, characterizing the configuration as high-risk and high-reward.
3. Drawdown & Consecutive Losses – Risk Exposure
- Drawdowns escalate sharply with higher risk %:
- At a 1.0% risk level, the maximum drawdown is 15.83%, which can be considered manageable.
- At a 3.5%risk level, the maximum drawdown exceeds 56%, which may be psychologically challenging.
- Consecutive losses remain stable (approximately 15-16 trades) regardless of RRR or risk %
- meaning traders must endure long losing streaks even in optimal setups.
4. Trade Requirements for a 30% Win-Rate System
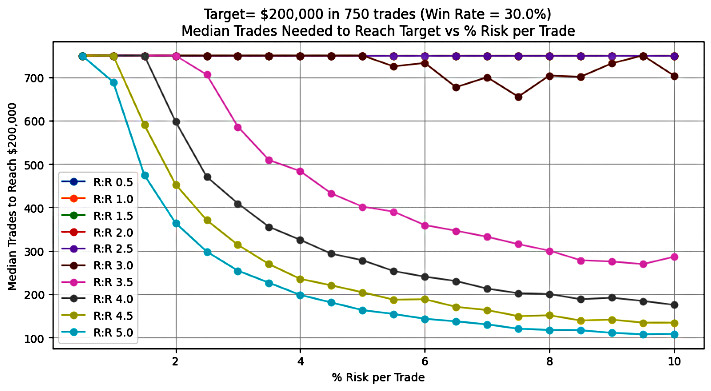
Figure 2: Number of trades for 30% win-rate system
Figure 2 illustrates the median number of trades required to achieve a predefined profit target, based on varying RRR and risk % under a 30% win-rate system. The data reveals a clear trend: increasing the risk % can significantly reduce the total number of trades needed to reach the target, particularly for certain RRR values.
For a 30% win-rate, the most notable change occurs when the RRR is greater than or equal to 3.5. In this range, raising the risk % leads to an exponential decline in the number of trades required. For example, at an RRR of 4, the trade count drops sharply—from approximately 750 trades at a 1.8% risk to just about 200 trades at a 10% risk.
The plot further indicates a threshold effect: an RRR of at least 3.5 combined with a risk of 2% marks the point where the exponential decline begins. Any combination of RRR and risk % exceeding this threshold results in progressively fewer trades needed to achieve the desired profit target.
This finding highlights the powerful impact of leveraging both risk % and RRR optimization, especially in lower win-rate systems, to accelerate target achievement and enhance trading efficiency.
Scenario 2: 45% Win-Rate — Profit Target of $200,000, Initial Balance of $1,000, 750 TradesIn this scenario, the trader begins with an initial balance of $1,000, aiming to reach $200,000 within 750 trades. Figure 3 visualizes the outcomes for different RRR and risk %, with the heat map interpretation following the same methodology as the 30% win-rate case.
The benchmark for minimum risk % is set as the lowest value that yields a success rate above 50%. This ensures that the probability of achieving the profit target is better than chance, providing a realistic edge.
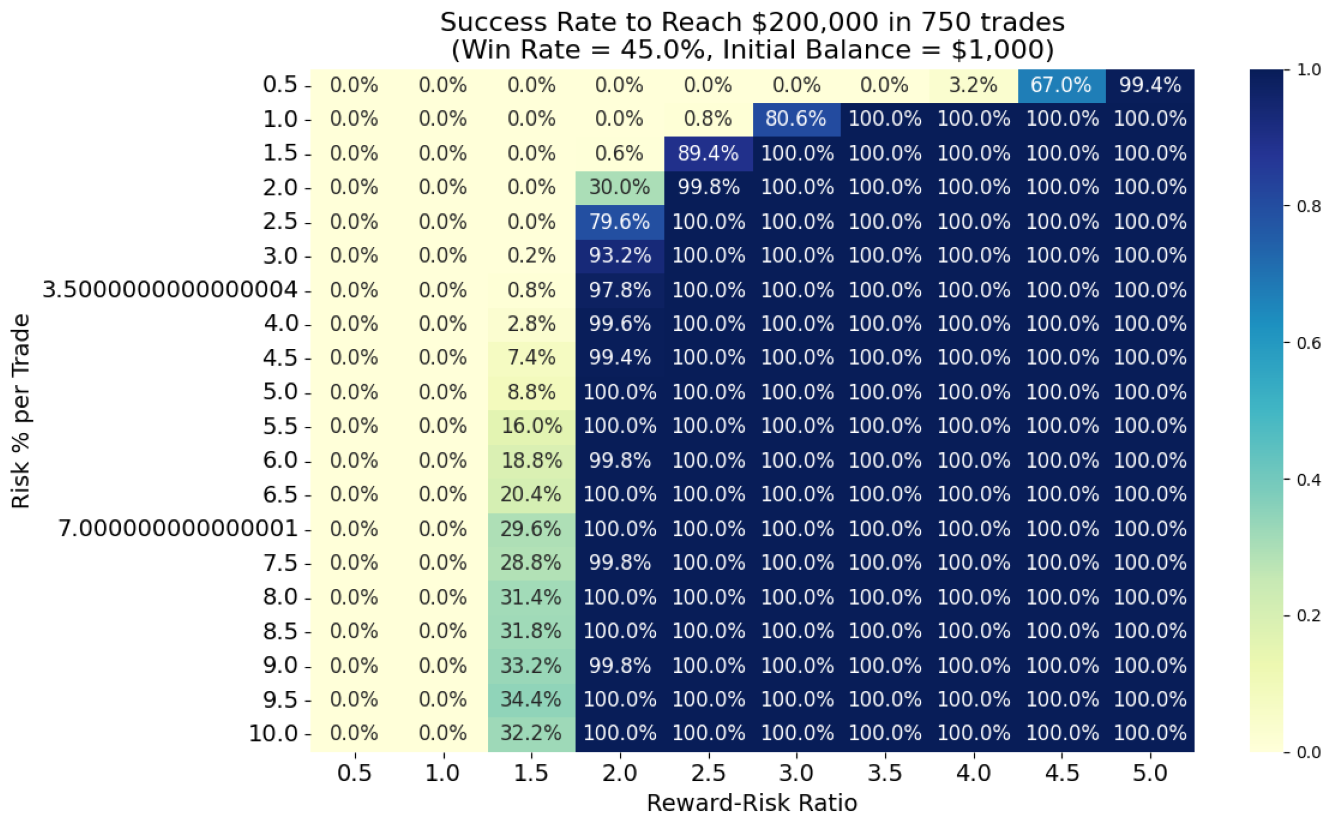
Figure 3: 45% win-rate system
For a 45% win-rate, a preliminary inspection of the chart suggests:
- At RRR = 2.0, a minimum risk of 2.5% is required to achieve the target within 750 trades.
- Increasing the RRR to 2.5 allows the trader to reduce the risk to 1.5%, still maintaining a high success rate of 89%.
- The performance here is notably better than with a 30% win-rate. The improved win probability reduces the dependency on high-risk, though it still surpasses the conventional 2% rule.
- Traders adhering strictly to the 2% cap would need either to increase the number of trades or lower their profit target to maintain a realistic expectations.
Table 2: Top 5 combinations with minimum success rate > 50% for 45% win-rate system.
| RRR | Risk % | Success Rate % | Median Final Balance | Median Max Drawdown % | Median Max Consecutive Losses |
|---|---|---|---|---|---|
| 4.5 | 0.5% | 67% | $240,520.00 | 4.89% | 10 |
| 2.0 | 2.5% | 79.6% | $428,435.00 | 28.97% | 10 |
| 3.0 | 1.0% | 80.6% | $320,832.00 | 10.47% | 10 |
| 2.5 | 1.5% | 89.4% | $475,505.00 | 16.20% | 10 |
| 2.0 | 3.0% | 93.2% | $1,268,636.00 | 34.89% | 10 |
Observations & Analysis
Rather than relying solely on "by eye", apply a reproducible criterion (e.g., more than 50% successful runs). Present the method used to identify the minimum/threshold values and provide the resulting Table 2.
1. Success Rate Analysis- High success achievable with moderate RRR:
- At RRR = 2.5 with a 1.5%risk per trade, the success rate reached 89.4%, demonstrating excellent reliability.
- Even at a conservative0.5% risk with an RRR = 4.5, the system achieved a 67% success rate, highlighting its flexibility of application.
- Exceptional performance at higher risk levels:
- With a 3.0%risk allocation at RRR = 2.0, the system produced a 93.2% success rate, representing the highest probability recorded in the dataset.
- This, however, was accompanied by a 34.89% maximum drawdown, necessitating considerable risk tolerance.
- Best Balanced Approach:
- With an RRR of 2.5 and a 1.5% risk setting, the model recorded an 89.4% success rate alongside a 16.2% maximum drawdown, levels generally considered psychologically manageable.
- The median account balance of $475k exceeded the target by a substantial margin.
- Most Conservative Option:
- For RRR of 4.5 and a 0.5% risk allocation, the model recorded a 67% success rate, a level considered acceptable for risk-averse traders.
- The corresponding maximum drawdown of 4.89% highlights the configuration’s exceptionally safe profile.
- High-Performance Choice:
- Using RRR of 2.0 and a 3.0% risk allocation, the system achieved a 93.2% success rate, representing near certainty in simulated outcomes.
- However, this was coupled with a 34.89% maximum drawdown, highlighting the importance of strict trading discipline.
- Consecutive losses capped at 10 across all scenarios:
- significantly better than 30% win-rate systems.
- Drawdown increases exponentially with risk %:
- Observed drawdowns spanned from 4.89% under a 0.5% risk allocation to 34.89% under a 3.0% risk allocation.
4. Trade Requirements for a 45% Win-Rate System
Figure 4: Number of trades for 45% win-rate system
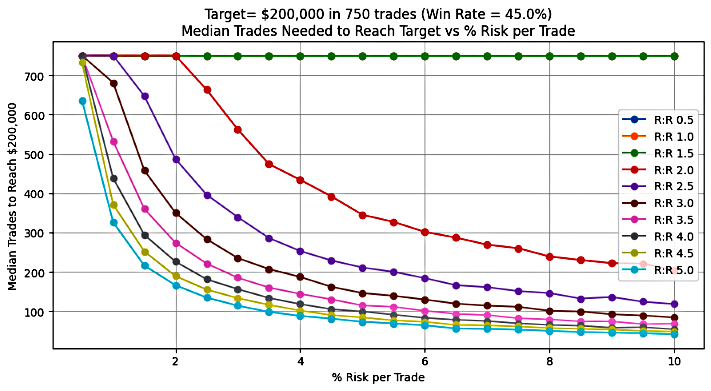
Figure 4 presents the median number of trades required to achieve a set profit target for varying RRR and risk % in a 45% win-rate trading system. The results demonstrate that increasing the risk % can significantly reduce the number of trades needed to meet the target, particularly at certain RRR levels.
For this win-rate, a marked change occurs when the RRR is greater than or equal to 2.0. In this range, raising the risk % leads to an exponential decrease in the trades required. For example, at an RRR of 2.5, the median number of trades falls dramatically—from about 750 trades at a 1.0% risk to nearly 250 trades at a 4% risk.
The analysis also identifies a clear threshold: an RRR of at least 2.0 combined with a risk of 2% is the point where the exponential decline begins. Any RRR–risk % combination exceeding this minimum will progressively shorten the path to the target.
Scenario 3: 76% Win-Rate — Profit Target of $200,000, Initial Balance of $1,000, 750 TradesFigure 5 illustrates the performance outcomes for a system with a 76% win-rate across varying RRR and position risk %. As with the 30% win-rate heat map, the color intensity represents the probability of achieving the profit target. In this scenario, the minimum acceptable risk % is defined as the lowest value that achieves a success rate above 50%.
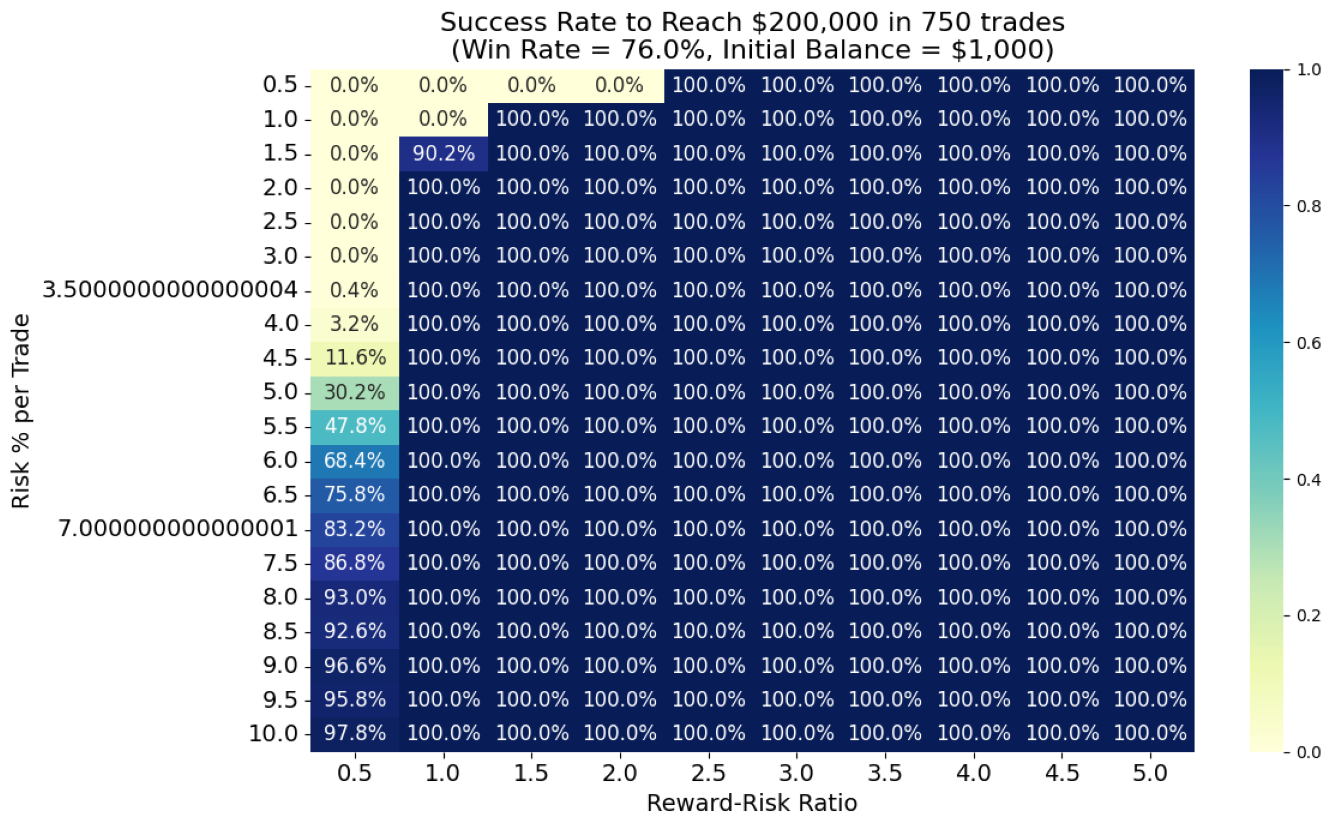
Figure 5: 76% win-rate system
For a 76% win-rate, visual inspection reveals that:
- At RRR = 0.5, the minimum risk required is 6%, which yields a 68.4% success rate.
- Increasing the RRR to 1.0 allows the trader to lower risk significantly to 1.5% while maintaining a 90.2% success rate—a dramatic improvement in capital preservation.
- Higher RRR values further enhance performance, allowing even lower risk exposure with higher success rates.
- Notably, the 2% risk management "rule" is only exceeded when trading with a very low RRR (0.5). At RRR = 1.0 or more, traders can achieve the target well within this limit.
For a trader, this means that with a 76% win-rate, the focus should shift towards maintaining a stable mindset and avoiding unnecessary risk escalation. Even modest RRR levels greater than or equal to 1 allow realistic profit targets with controlled drawdowns.
Table 3: Top 5 combinations with minimum success rate > 50% for 76% win-rate system
| RRR | Risk % | Success Rate % | Median Final Balance | Median Max Drawdown % | Median Max Consecutive Losses |
|---|---|---|---|---|---|
| 0.50 | 6.0% | 68.4% | $331,086.00 | 35.86% | 4 |
| 0.50 | 6.5% | 75.8% | $460,707.00 | 39.14% | 4 |
| 0.50 | 7.0% | 83.2% | $625,853.00 | 41.73% | 4 |
| 0.50 | 7.5% | 86.8% | $1,044,076.00 | 42.87% | 4 |
| 1.00 | 1.5% | 90.2% | $319,275.00 | 7.28% | 4 |
Observations & Analysis
The same procedure used to generate Tables 1 and 2 was applied, and the corresponding results are presented in Table 3.
1. Success Rate Analysis- Remarkable consistency even at low RRR:
- Utilizing RRR of 1.0 and a 1.5% risk setting, the model produced a 90.2% success rate alongside a limited 7.28% maximum drawdown.
- By contrast, achieving comparable outcomes at RRR = 0.5 required substantially higher risk levels of 6–7.5%, though success rates remained between 68% and 87%.
- Perfect performance possible:
- With an RRR of 1.5 and a 1.0% risk allocation, the model produced a 100% success rate under simulated conditions, though real-world factors may alter this outcome.
2. Optimal Risk/Reward Combinations
3. Drawdown & Consecutive Losses
- Best Overall Strategy
- At RRR of 1.0 with a 1.5% risk per trade, the system achieved a 90.2% success rate with only a 7.28% maximum drawdown.
- The median balance reached $319k; around 60% above target, while remaining fully aligned with the 2% risk management rule.
- Aggressive Growth Option
- For RRR of 0.5 and a 7.5%risk allocation, the model delivered an 86.8% success rate and indicated the possibility of returns exceeding 1000%.
- This outcome was accompanied by a 42.87% maximum drawdown, highlighting the necessity for strong trader discipline.
4. Trade Requirements for a 76% Win-Rate System
- At RRR of 0.5, drawdowns range from 35.9% to 42.9% which can be psychologically challenging despite the high win-rate.
- Using RRR of 1.0 with 1.5% risk per trade, drawdown drops dramatically to 7.28% - improving survivability during bad streaks.
- Median consecutive losses remain constant at 4 - suggesting that higher risk primarily affects volatility and drawdowns rather than the losing streak length.
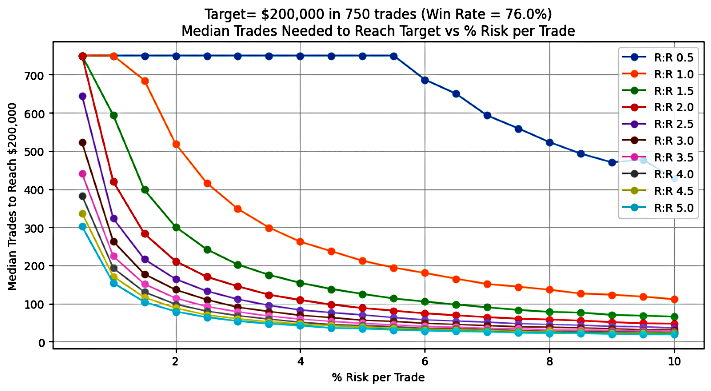
Figure 6: Number of trades for 76% win-rate system
Figure 6 depicts the median number of trades required to achieve a defined profit target for different RRR and risk % in a 76% win-rate trading system. The data confirms that increasing the risk % can substantially reduce the number of trades needed to reach the target, particularly for specific RRR values.
For this high win-rate scenario, a significant shift occurs when the RRR is greater than or equal to 0.5. Beyond this point, raising the risk % produces an exponential decline in the number of trades required. For example, at an RRR of 1.0, the trade count drops sharply, from roughly 750 trades at a 1.0% risk to about 200 trades at a 6% risk.
The plot identifies a distinct threshold; an RRR of at least 0.5 combined with a risk of 6% marks the beginning of this exponential reduction. Any combination above these minimums results in progressively fewer trades needed to meet the profit target. Notably, at an RRR of 2.5 with a 1% risk, the required trade count is slightly above 300, consistent with the earlier calculations presented in this article.
Throughout the simulated results, it was noted that the target can potentially be met at an exceptionally high success rate. It is important to note, however, that the model did not account for slippage, transaction costs, or swap fees typically present in real trading conditions.
Beyond analysis, the chart serves as a trade quantity profile—a practical reference for traders to determine the number of trades required to meet specific profit goals under varying RRR and risk % combinations.
Code Instruction
# Parameters
initial_balance = 1000
target_balance = 200000
win_rate = 0.76  # 76%
tgtBalance = f'${target_balance:,}'
initialBal = f'${initial_balance:,}'

# Time horizon
years = 3
trades_per_year = 250  # roughly 1 trade per day
total_trades = trades_per_year * years

# Reward-Risk Ratio (to be varied in simulation)
reward_risk_ratios = np.arange(0.5, 5.5, 0.5)

# Risk per trade (to be varied in simulation)
risk_percents = np.arange(0.5, 10.5, 0.5) / 100

# Monte Carlo simulation settings
num_simulations = 500
np.random.seed(84)  # for reproducibility
The following parameters in the Python code allow customization and experimentation with different trading scenarios:
- Win-rate
- RRR
- Risk %
- Number of simulations to run
These input parameters form the basis for testing various strategies and analyzing their potential performance.
Conclusion
This analysis demonstrates that determining the minimum risk % to achieve a set profit target within a defined trading period is both a mathematical and psychological exercise. For the tested scenarios, the results show that higher win-rates reduce the required risk per trade, but the relationship is strongly influenced by the RRR.
The evaluation of drawdown and consecutive losses highlights the inherent trade-off between profitability and account volatility. Even with a robust win-rate, an overly aggressive risk level can lead to drawdowns that challenge a trader’s emotional discipline and capital stability.
From a feasibility standpoint, the findings suggest that while the profit target may be attainable under certain parameter combinations, in other cases it may be overly ambitious without increasing either the RRR, the win-rate, or the trading frequency.
Finally, the study identifies key parameters such as RRR, risk %, and win-rate, that can be optimized to improve success rates while keeping drawdowns manageable. By strategically adjusting these levers, traders can align their systems more realistically with their performance goals, enhancing both sustainability and long-term profitability.
We observe that increasing the number of trades can help achieve the profit target with profitable systems. However, in practice, high-probability setups with high RRR often occur less frequently, limiting trade opportunities. In our next article, we will explore how to leverage multiple entries on a single setup to accelerate progress toward trading objectives without compromising system integrity.Warning: All rights to these materials are reserved by MetaQuotes Ltd. Copying or reprinting of these materials in whole or in part is prohibited.
This article was written by a user of the site and reflects their personal views. MetaQuotes Ltd is not responsible for the accuracy of the information presented, nor for any consequences resulting from the use of the solutions, strategies or recommendations described.
 Automating Trading Strategies in MQL5 (Part 29): Creating a price action Gartley Harmonic Pattern system
 Multi-module trading robot in Python and MQL5 (Part I): Creating basic architecture and first modules
 Neural Networks in Trading: A Multi-Agent Self-Adaptive Model (Final Part)
 MetaTrader Meets Google Sheets with Pythonanywhere: A Guide to Secure Data Flow
- Free trading apps
- Over 8,000 signals for copying
- Economic news for exploring financial markets
You agree to website policy and terms of use
Great effort thumbs up 👍
@Israr Hussain Shah
Thank you.