Discussion of article "Using MATLAB 2018 computational capabilities in MetaTrader 5"
In R, this and other more complex models are created in a few lines. Not commensurate time consumption. Besides, for each new model you have to write your original code.
Not promising. Although for those who are strong inside MATLAB may be an option.
But the work done is impressive.
Good luck
Should I tweak it here? No?

Good luck.
Should I tweak it here? No?
Good luck.
You mean there's a mistake? Where exactly and what should I change? I don't see it.
You mean there's been a mistake? Where exactly and what should I change? I don't see it.
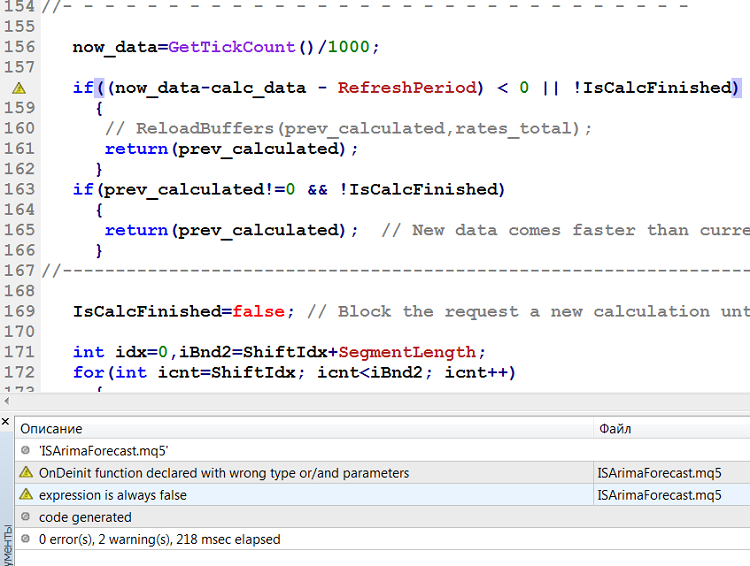
There's something wrong with that expression. Look at this. The expression always says FALSE.
There's something wrong with that expression. Look at this. The expression always says FALSE.
It seems to be an excessive "over-insurance" for the used time step. It turns out that the processing took place faster than the new count. This also possibly indicates good computer performance. Since the condition is false, it does not affect the algorithm. It would be worse if it were true too often). I will work on the development of the indicator and "move" the condition so that it is not so meaningless. Thank you for the comment.
It looks like there is excessive "over-insurance" for the time step used. It turns out that the processing was done faster than the new countdown. This may also possibly indicate good computer performance. Since the condition is false, it does not affect the algorithm. It would be worse if it were true too often). I will work on the development of the indicator and "move" the condition so that it is not so meaningless. Thank you for the comment.
Good luck
It looks like there is excessive "over-insurance" for the time step used. It turns out that the processing was done faster than the new countdown. This may also possibly indicate good computer performance. Since the condition is false, it does not affect the algorithm. It would be worse if it were true too often). I will work on the development of the indicator and "move" the condition so that it is not so meaningless. Thanks for the remark.
This is a compiler warning, not related to processing speed. The condition uses unsigned variables of type uint, they can never be < 0. Replace with int so you can get a negative difference.
This is a compiler warning not related to processing speed. The condition uses unsigned variables of uint type, they can never be < 0. Replace with int so you can get a negative difference.
Thanks for the tip.
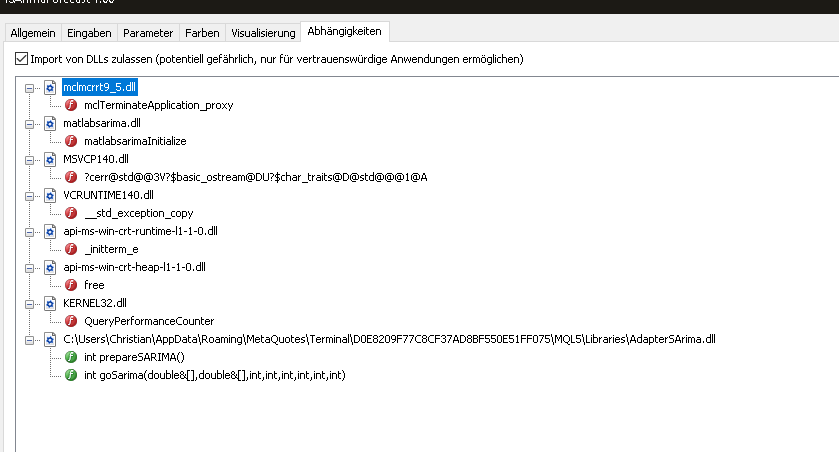
have you ever tested the files on a clean installation of windows 10?

No matter what I do he does not load the runtime dlls from the mcr package.

Ive download the MCR Runtime


http://ssd.mathworks.com/supportfiles/downloads/R2018b/deployment_files/R2018b/installers/win64/MCR_R2018b_win64_installer.exe
Thanks for help.
- Free trading apps
- Over 8,000 signals for copying
- Economic news for exploring financial markets
You agree to website policy and terms of use
New article Using MATLAB 2018 computational capabilities in MetaTrader 5 has been published:
After the upgrade of the MATLAB package in 2015, it is necessary to consider a modern way of creating DLL libraries. The article uses a sample predictive indicator to illustrate the peculiarities of linking MetaTrader 5 and MATLAB using modern 64-bit versions of the platforms, which are utilized nowadays. With the entire sequence of connecting MATLAB considered, MQL5 developers will be able to create applications with advanced computational capabilities much faster, avoiding «pitfalls».
Performance of the indicator was tested on the EURUSD H1 trading data, provided by the MetaTrader platform. A not too large segment of data was selected, equal to 450 units. Long-period "seasonal" lags equal to 28, 30 and 32 units were tested. The lag with a period of 32 units was the best of them on the considered period of history.
A series of calculations for different history fragments was performed. In the model, data segments length of 450 units, seasonal lag of 32 units and prediction length of 30 units were set once and did not change. To assess the quality of the forecast, the results obtained for different fragments were compared with actual data.
Below are the figures showing the result of the indicator operation. In all figures, the chocolate color indicates the completion of a fragment used for selecting the SARIMA(2,1,2) model, and the result obtained on its basis is shown in blue.
Author: Roman Korotchenko