
AutoElliottWaveMaker - MetaTrader 5 Tool for Semi-Automatic Analysis of Elliott Waves
Introduction
The article "The Implementation of Automatic Analysis of the Elliott Waves in MQL5" dealt with the Elliott Wave automatic wave labeling algorithm that suffered from a few imperfections, one of which being its slowness. Realizing that, and the fact that automatic analysis on its own is not really suitable for practical use, it was decided to develop a semi-automatic wave labeling tool that would offer a number of advantages:
- Human-controlled labeling;
- High speed of the analysis due to the fact that only the user-specified part of the chart is analyzed.
This program was called AutoElliottWaveMaker and will be introduced in this article. AutoElliottWaveMaker is a logical development of the manual wave labeling tool which can currently be bought in the Market.
1. Program Objects
The main objects of the program are labels and the labels panel (Fig. 1).
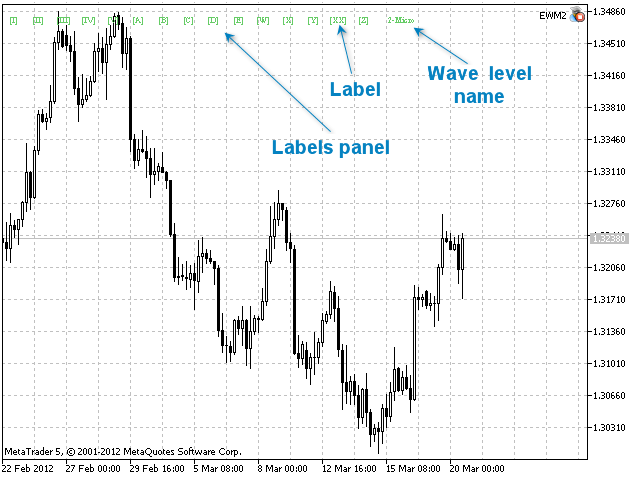
Fig. 1. The labels panel
The labels panel represents a sequence of labels of one wave level situated in the top left part of the chart. The position of the panel and the distance between the labels are customized by the user in the program input parameters (Fig. 2):
- interval - the distance between the labels on the labels panel;
- x_distance - the position of the labels panel along the X-axis relative to the top left corner of the chart;
- y_distance - the position of the labels panel along the Y-axis relative to the top left corner of the chart.
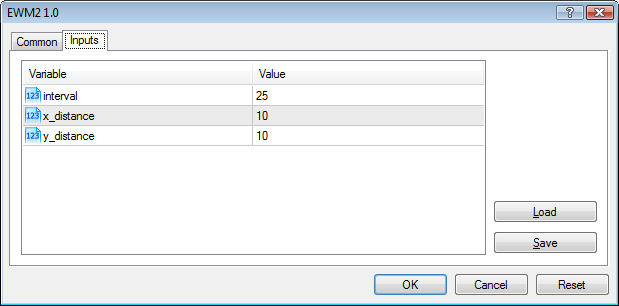
Fig. 2. Input parameters of the program
The labels panel also displays the name of the current wave level (Fig. 1).
You can hide/show the labels panel by pressing the Esc key. To display the labels of the preceding or the following wave level on the labels panel, press Q or W, respectively.
Labels can be moved from the labels panel using the drag and drop method. Upon the move of a label, the labels panel is restored to its initial state. The panel is not restored after a label is removed from the labels panel. In order to restore it, you have to go to another wave level and then back.
The number and style of wave levels and labels is set in the Levels.txt file automatically generated when you first start the program. The Levels.txt file is located in the Files folder of the MetaTrader 5 terminal data directory. By editing the file, the user can change the style of wave levels (Fig. 3).

Fig. 3. Levels.txt content
Let us take the fourth line of the file as an example and have a look at it:
- SubMinuette - name of the wave level;
- i, ii, iii, iv, v, a, b, c, d, e, w, x, y, xx, z - wave tops;
- Times New Roman - font;
- 8 - font size;
- 15 - font height in pixels;
- 255, 140, 0 - color in RGB format.
When editing the file, the following constraints should be set:
- the number of wave tops shall be 15;
- notations for every wave top shall be different.
Further, to ensure the proper operation of the program, it is necessary to set "Unlimited" as the "Max bars in chart" value in the MetaTrader 5 terminal settings (Main Menu-Tools-Options-Charts).
2. Wave Labeling Process
Elliott Waves are labeled in the manual and/or automatic mode.
The manual mode, in its turn, presupposes two ways of labeling:
- By dragging the labels from the labels panel;
- By clicking near the bars on the chart.
The automatic mode suggests that the chart is labeled based on the program's algorithm. That said, the analysis can cover the entire chart or any part thereof (from one label to another), as specified by the user.
2.1. Manual mode
In the manual labeling mode, the labels appear above or below the bars by themselves and are adjusted automatically when the chart scale or size changes. The labels are placed in the order of precedence of wave levels. Thus, if there are two or more wave labels above or below the same bar, the label of the senior wave level will be placed respectively higher or lower than the label of the junior wave level (Fig. 4 and Fig. 5).
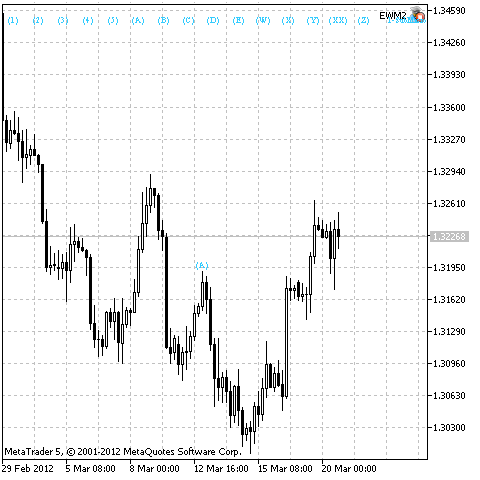
Fig. 4. Position of labels before labeling
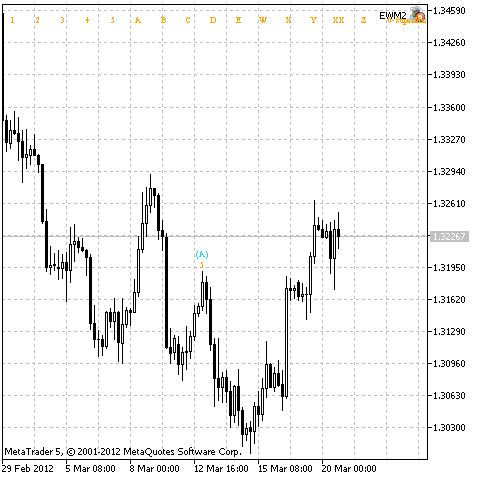
Fig. 5. Position of labels after labeling
Fig. 4 shows that there is a label (A) of the SubMicro wave level above the bar. Label 5 was placed above the same bar on a lower level - SuperMicro. Since the SuperMicro level is lower than SubMicro, label 5 appears under the label (A) (Fig. 5).
Consideration must also be given to the fact that when labeling manually, wave labels are placed above/below the nearest bar whose high/low is higher/lower than those of the neighboring bars. This specific feature allows to position labels in the chart more accurately.
As mentioned above, labeling in the manual mode can be done in two ways. And while the drag-and-drop procedure is more or less clear, the click-based labeling has its peculiarities.
When labeling using the mouse clicks, you should select a label on the labels panel. It can also be done by pressing the Z key in succession (in which case you can switch between the labels on the panel as you cycle through). The labeling of the current wave level is then done by clicking the mouse at required bars on the chart. To complete the labeling process, click on any label or press the X key.
The labeling continues for as long as there is a selected label on the labels panel. Every mouse click selects the successive label. The last label completes the click-based labeling process.
2.2. Automatic mode
Automatic labeling of the chart is done using control keys. There are three automatic labeling variants:
- Chart analysis up to selected label;
- Chart analysis after selected label;
- Analysis of the entire chart if no label is selected.
The first variant of automatic labeling is performed upon pressing 1. The chart will in this case be analyzed from its beginning up to the selected label, if there is no other label on its left. Otherwise the analysis will be performed from the nearest label on the left up to the selected label.
Fig. 6 shows two labels in the chart. The second label is selected. After pressing 1, the part of the chart between the labels will be analyzed. The result of the analysis is shown in Fig. 7.
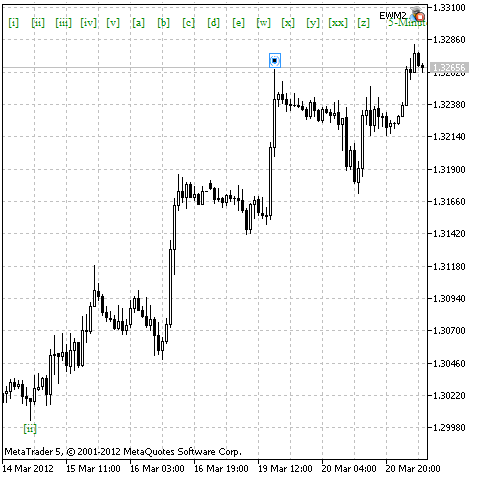
Fig. 6. Initial state of the chart prior to pressing 1
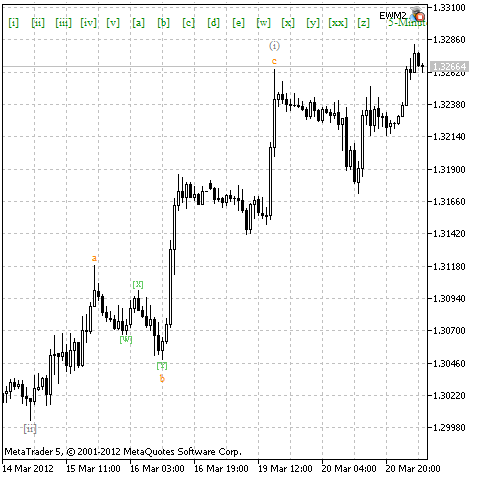
Fig. 7. Result of the automatic analysis of the part of the chart between the labels
The second variant of labeling is activated by pressing 2. The chart will in this case be analyzed from the selected label up to the end of the chart, if there is no other label on its right. Otherwise the analysis will be performed from the selected label up to the nearest label on the right.
Fig. 8 displays one label in the chart. This label is selected. After pressing 2, the analysis will be performed for the part of the chart from the label up to the end of the chart. The result of the analysis is shown in Fig. 9.
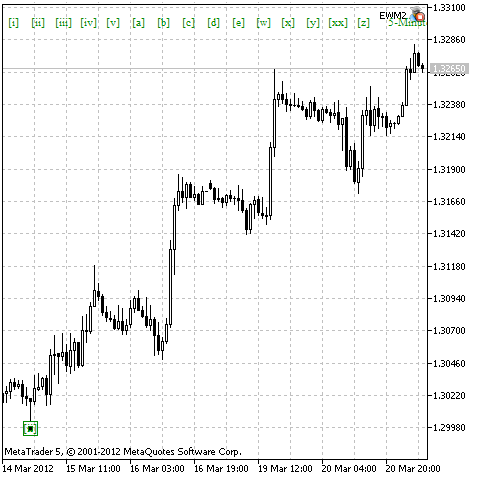
Fig. 8. Initial state of the chart prior to pressing 2
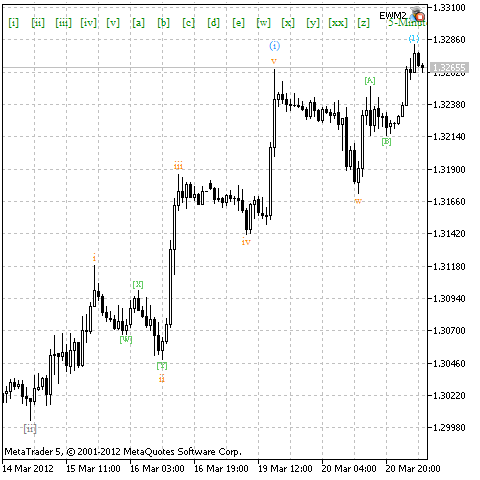
Fig. 9. Result of the automatic analysis of the part of the chart from the label up to the end of the chart
The third variant of the analysis will start after pressing 1 or 2. All the chart labels in this case will first be removed.
Immediately following the automatic analysis of Elliott Waves, the variants of labeling will be available for viewing.
There are 3 options available to view the analysis results:
- Viewing the labeling variants of the selected wave;
- Viewing the labeling variants of the wave following the selected wave;
- Viewing the labeling variants of the analyzed section of the chart if no wave label is selected.
You can navigate through the labeling variants using the following keys: 3 (view the previous variant) and 4 (view the next variant) for the first viewing option, 5 (view the previous variant) and 6 (view the next variant) for the second viewing option, and any of the above keys for the third viewing option.
Fig. 10 demonstrates the next labeling variant for the wave that was previously automatically labeled and showed in Fig. 7.
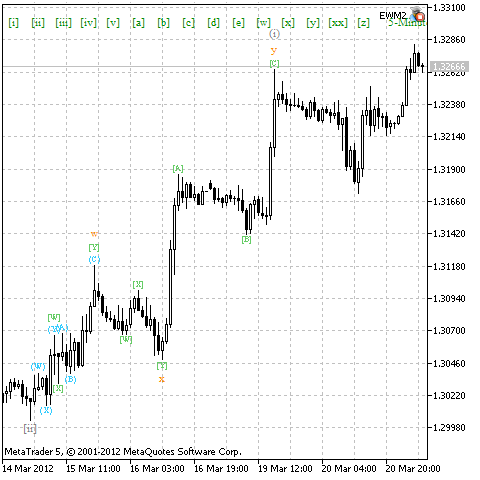
Fig. 10. The next labeling variant for the selected wave
As can be seen in Fig. 7, 9 and 10, some labels are displayed in gray which is the color labels take before the start of the automatic labeling. These are labels that were present in the chart before the analysis. And they are not available for mouse selection. All of this is necessary to distinguish between the manual and automatic labeling.
To convert automatic labeling into manual, you need to press the V key whereupon all the labels in the chart will take their former color and will be available for selection. However once the V key has been pressed, viewing of the labeling variants becomes impossible.
Information on the name of any wave obtained after the automatic analysis is also available to the user. This information is displayed in the top part of the chart (Fig. 11) immediately following the analysis, after a label is selected or control keys for viewing the labeling variants are pressed.
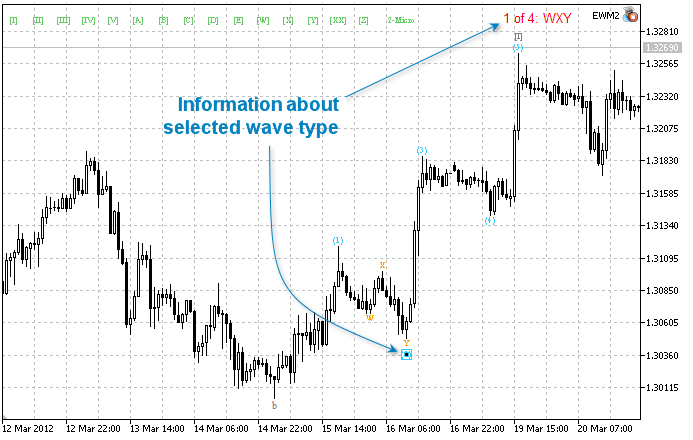
Fig. 11. Information on the selected wave type
It should be noted that automatic analysis is performed on the basis of certain wave rules. Wave identification rules are stored in the Rules.txt file generated when you first start the program. This file is located in the Files folder of the MetaTrader 5 terminal data directory.
3. Extra Features
Any label in the chart can be included into a certain group of labels that can be selected. A group of labels is selected by selecting any label in the chart and pressing the Tab key. Selection covers all labels forming the same group with the selected label. To deselect, press the Tab key one more time.
Labels can be added to a group by selecting any label and then creating new labels. New labels are added to the group to which the selected label belongs.
Every selected label in the chart can be manipulated as follows:
- Deleted using the Del key;
- The wave level can be decreased or increased using the A or S keys, respectively.
Further, the program algorithm features an automatic mechanism determining the number of displayed wave levels on the current time frame. The algorithm is based on the following principle: labels with different coordinates along the time axis cannot be placed on the same bar. The number of wave levels can also be controlled manually using the E and R keys that allow to decrease and increase wave levels, respectively.
4. List of Keyboard Commands
Fig. 12 shows all applicable keyboard commands and their descriptions.
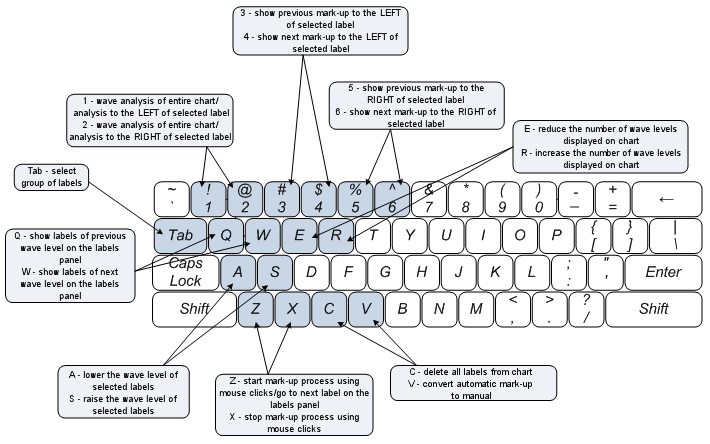
Fig. 12. Keyboard commands
Conclusion
The article has introduced the first development for semi-automatic analysis of Elliott Waves in MetaTrader 5. This program has a number of unique features:
- Automatic binding of wave top labels at the bars in charts of all time periods;
- Labeling of wave tops by both dragging labels from the labels panel and clicking the mouse in succession;
- Automatic labeling of wave tops in the order of precedence of wave levels in charts of all time periods;
- Automatic and manual control over the number of wave levels displayed in the chart;
- Creating custom styles for labeling wave levels;
- Automatic analysis of Elliott Waves covering the entire chart as well as a part thereof (from one label to another);
- Viewing the variants of automatic labeling;
- Ability to edit wave rules;
- Control over the labeling process using the mouse and keyboard.
This development demonstrates great resources of the MQL5 language and will hopefully encourage developers to create complicated and interesting programs.
Translated from Russian by MetaQuotes Ltd.
Original article: https://www.mql5.com/ru/articles/378
Warning: All rights to these materials are reserved by MetaQuotes Ltd. Copying or reprinting of these materials in whole or in part is prohibited.
This article was written by a user of the site and reflects their personal views. MetaQuotes Ltd is not responsible for the accuracy of the information presented, nor for any consequences resulting from the use of the solutions, strategies or recommendations described.
 The Simple Example of Creating an Indicator Using Fuzzy Logic
 Who Is Who in MQL5.community?
 Synthetic Bars - A New Dimension to Displaying Graphical Information on Prices
 Getting Rid of Self-Made DLLs
- Free trading apps
- Over 8,000 signals for copying
- Economic news for exploring financial markets
You agree to website policy and terms of use
Forum on trading, automated trading systems and testing trading strategies
Something Interesting to Read March 2014
newdigital, 2014.03.13 09:30
The Wave Principleby Ralph Nelson Elliott
The Elliott Wave Principle is a form of technical analysis that some traders use to analyze financial market cycles and forecast market trends by identifying extremes in investor psychology, highs and lows in prices, and other collective factors. Ralph Nelson Elliott, a professional accountant, discovered the underlying social principles and developed the analytical tools. He proposed that market prices unfold in specific patterns, which practitioners today call Elliott waves, or simply waves. Elliott published his theory of market behavior in this book "The Wave Principle". Elliott stated that "because man is subject to rhythmical procedure, calculations having to do with his activities can be projected far into the future with a justification and certainty heretofore unattainable."
Hi, I try it, but for me, there are no labels displayed. I am trying with esc key, or q or e but nothing.
Where is problem?
In graph - right corner is icon, that ea is loaded properly. Autotrading is ON.
Not working with me. i try under Win XP and Win 10, i think i've placed all the file in the right place
Thank you