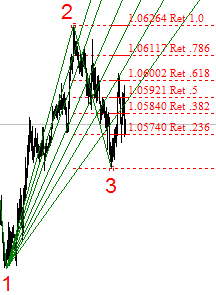
ZUP - universal ZigZag with Pesavento patterns. Graphical interface
Introduction
Ten years have passed since the first articles about the ZUP indicator platforms were published. During this time, many new versions have been developed. Currently, the indicator platform features over 400 parameters which greatly complicates the setting. We have received numerous requests from users to develop a graphical interface for working with ZUP. Starting from the version 151, the indicator platform features the built-in graphical interface. As a result, now we have a graphical add-on for MetaTrader 4 allowing you to quickly and conveniently analyze market data. The article describes how to work with the graphical interface of the ZUP indicator platform.
Graphical interface panel
To work with the graphical interface, set ExtPanel=true. This parameter can be found at the end of the parameters list. The panel appears in the upper left corner of the window chart:

If the panel is removed by pressing the ESC button or is not displayed when launching the indicator, it can be activated by SHIFT-Z shortcut. Each panel symbol is a functional button.
16 symbols, from [i] to o, are used to create the chart wave marking. The Minute button displays the name of a wave level that can be currently created. By clicking on it, you can change the color and symbols size of a selected wave level:
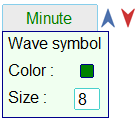
Colors of symbols on the panel match the color of a selected wave level. A wave level is selected using the arrows. The Insert button enables the menu for selecting graphical tools to be displayed on the chart. When hovering the cursor over the red arrow, the name of a wave level located below is displayed in a tooltip:

When hovering the cursor over the blue arrow, the following wave level is displayed in a tooltip. Clicking the arrow will plot the level on the panel. Many ZUP graphical elements displayed on the chart are provided by context-sensitive pop-up tips. We will dwell on some of them later.
The ! button enables the settings panel:
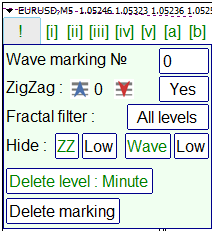
Initially, only Wave marking [0] line is displayed on the panel. As soon as any wave marking symbol is added to the chart, the panel expands to the full.
The Wave marking line allows you to set the wave marking index. Wave markings are created for a certain market tool, for example, for EURUSD. Multiple wave markings can be created for each market tool: the number of layouts is limited exclusively by free space on the disk where the terminal is installed. A wave marking previously created in one EURUSD window can then be displayed in any EURUSD chart afterwards. Just set its index.
When creating a wave marking, a wave ZigZag in the form of a line connecting its symbols is plotted. The ZigZag is created on the current wave level as well as all lower wave levels. On the lower and current wave levels, the ZigZags are similar except for the line color. When plotting a wave color on a lower wave level, the ZigZag is corrected according to the wave symbols applied to the chart.
In the ZigZag line, use the arrows to select the ZigZag line width on the current wave level. The Yes/No button is used to enable/disable showing the ZigZag as a line. If No, the ZigZag is displayed as dots on extreme points.
The Fractal filter line sets the fractal filtration mode. The fractal filtration will be discussed a bit later.
The Hide line sets the hiding of the current line by the ZZ button or all ZigZag lines of the lower wave levels by the Low button. Here you can also hide the current wave level by the Wave button or all lower wave levels by the second Low button.
The last two lines are used to completely remove the wave layout of the selected level or the entire wave layout with the selected index. Attention! Removed wave marking cannot be restored since its archive file is physically deleted. Therefore, after clicking the removal button, you should confirm your action once again.

The info on the settings panel depends on whether a wave marking with the selected index is created or not.
If a button is pressed on the graphical panel, selection can be canceled in several ways.
- Clicking the button again.
- Clicking ESC.
- Clicking another button on the panel.
Clicking the buttons of the menu enabled by the Insert button.
Creating a wave marking
Characters from [i] to [Z] are fifteen wave symbols. Select one symbol for creating a wave marking. A selected symbol is highlighted in gray. After it is applied to the chart, the next symbol is highlighted automatically. The marking can be completed in several ways:
- click the left mouse button on the highlighted symbol;
- press ESC;
- click other panel elements.
"O" character is selected when we are not interested in the wave marking itself but instead we need to draw a ZigZag line between selected extreme points on the current wave level in order to bind graphical tools to the ZigZag extreme points. These extreme points are marked by О letters instead of wave symbols.
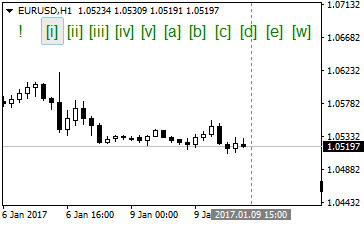
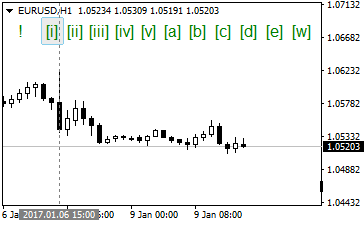
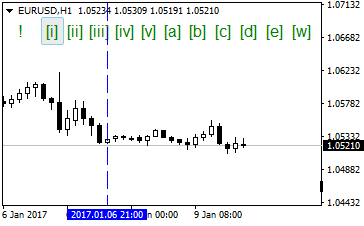
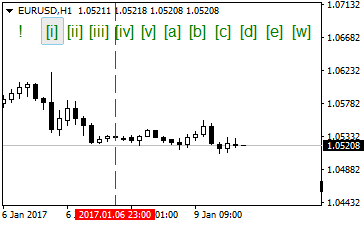
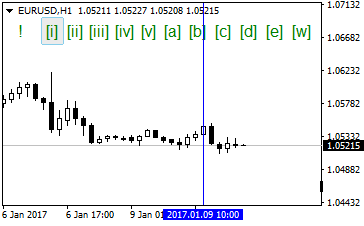
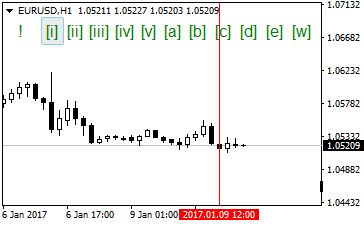
When selecting a wave symbol, a vertical line allowing you to accurately plot the symbol above/below a chart extreme point is displayed on a screen. The vertical line color and style show where the cursor is located relative to a bar.
This graphical representation shows that the wave symbol is not set on a chart here.
2) Cursor above/below a bar without an extreme point. The line consisting of long blue/red dashes is displayed.
3) The cursor is above/below the bar with an extreme point. The solid blue/red line (the blue line — the cursor is above the bar, the red line — the cursor is below the bar) is displayed.
If we click on any distance from the bar's High/Low, a symbol highlighted on the graphical panel is displayed on the chart. The symbol is automatically built into the hierarchy together with wave marking symbols previously displayed on the bar and is located at a certain distance from the bar. Symbols of the lesser wave levels are located closer to the bar. In order for a wave symbol to locate exactly above/below a selected bar, click on the vertical line.
If the symbol is occasionally displayed on an adjacent bar, it can be highlighted in two mouse clicks and dragged to the selected bar. The highlighted symbol can also be removed by pressing the Delete key. Only one symbol can be highlighted simultaneously.
A wave marking can be created only on the available history of quotes.
A wave marking and a wave ZigZag can be plotted above the already displayed ZigZag. When selecting a ZigZag using the ExtIndiсator parameter, a wave marking can be created above the plotted ZigZag. If ExtIndiсator=15, the wave marking is plotted on a clean chart.
Fractal filtration
The ZUP version 151 features a few fractal filtration options.
Option #1
Here we consider fractals similar to the ones described by Benoit Mandelbrot.
Suppose that we have the wave of the Intermediate level. This wave, in turn, consists of three or five Minor levels. A Minor level five-wave/three-wave structure is a single fractal. In other words, separate five-wave level and three-wave structures are fractals. Each wave of the same wave level is composed of several waves of the lower wave level. Lower-level waves included into a single higher-level wave are a single fractal.
Large and small fractals can be on the same wave level. All fractals have their dimensions. Some fractals are distorted when switching from one timeframe to another. For example, when moving to a higher timeframe, several lower timeframe fractals are merged into one bar of the higher timeframe. The bar's extreme point when the wave ends is located somewhere in the middle of the bar. This is just one type of distortion. Another type occurs when two or several adjacent waves merge into a single bar.
After detecting such distortions, the appropriate fractal is sorted out and removed from the chart. This type of fractal filtration applies to wave marking. Instead of removing an entire wave level containing distortions, only the fractals (five-wave or three-wave constructions) with a distorted wave structure are deleted.
The fractal filtration of this type can be of two types.
- When detecting a distorted fractal, it is removed only on the wave level it belongs to.
- When detecting a distorted fractal, all lower wave levels included into its structure are removed as well.
You can switch to any of these two types of fractal filtration in the Fractal filter line of the settings panel.
Removal of all included levels is enabled by default. However, you may also select removal of a single wave level. An example with a conventional marking is provided below. Please note: do not consider this marking to be correct. This is only an example illustrating the fractal filtration. We have the following marking:
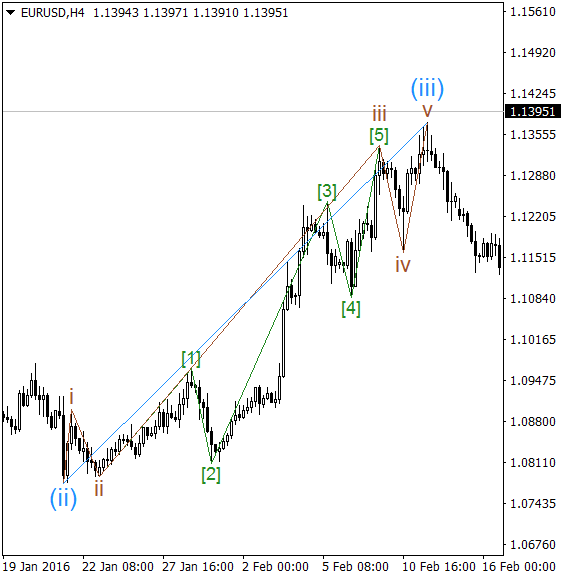
Switch from H4 to D1. Filtration of all levels:

Filtration of each level:

As we can see, the distorted medium level is removed, while higher and lower levels remain intact. The middle level's first wave (generated at 21.01.2016, 20-00, H4) is absorbed by a day bar with the High generated at H4, 21.01.2016, 08-00.
This is a purely theoretical example. Since intermediate levels are hidden during the fractal filtration, while lower levels remain on the chart, the question arises about the correctness of the generated wave marking.
Fractals possessing lower fractal dimensions are removed first.
Option #2
In this case, the conditional fractals are removed as well. Displaying various graphical tools on the chart will be discussed next. Graphical tools displayed on the chart using the graphical interface can be applied to several consecutive extreme points. Number of extreme points for binding varies from two to seven depending on a graphical tool type.
The fractals for the second fractal filtration option are conditional. Here the fractals are a collection of extreme points a graphical tool is bound to. Some graphical tools are real fractals (e.g. Gartley patterns).
The second fractal filtration option is constantly enabled. Graphical tools are automatically removed from the timeframes where they are displayed in a distorted way. When hovering the cursor over a graphical tool, the timeframes range, within which the tool or its main elements can be displayed without distortions, is shown in a tooltip. For example, some graphical elements of the Andrews' Pitchfork begin to appear distorted on higher timeframes. This happens due to some nuances of plotting the elements in MetaTrader. The same is true for Fibo channels included into the Andrews' Pitchfork set. The line of the displayed spiral also starts to appear distorted when switching to higher timeframes.
Displaying graphical instruments using graphical interface
The Insert button on the graphical interface panel is similar to the same button of the MetaTrader terminal. It brings up the menu for selecting the graphical tools:

Most icons here are similar to the corresponding icons of the MetaTrader graphical tools. However, there are some others as well.
Below is the list of the graphical tools.
- Fibonacci Channel
- Equidistant Channel
- Andrews' Pitchfork
- Fibonacci Levels
- Fibonacci Time Zones
- Fibonacci Fans
- Fibonacci Arcs
- Fibonacci projections
- Logarithmic spiral
- Versum levels
- Pesavento patterns
- Gartley patterns
Also, the menu has three buttons.
- Peak ZZ — display index numbers of extreme points for ZigZags built into ZUP
- Hide — hide all graphical tools of the selected type created using the graphical interface.
- Del — deleted a selected graphical tool (without the possibility of recovery!)
Select one of the twelve graphical tools using the mouse. If the tool has not been previously selected on the chart, the appropriate icon turns gray. Otherwise, the tool editing menu is additionally displayed.
Graphical tools can be launched on a chart only if one of the built-in ZigZags is already present on it or a wave ZigZag has been created. If the wave marking is created, while the wave ZigZag is hidden using the panel's ZZ or Low buttons in the Hide line, a graphical tool can be bound to the wave marking. In order to bind graphical tools to the built-in ZigZags, ZigZag extreme points should be indexed. The rightmost anchor point is used for binding to the wave ZigZag's wave marking symbols or the built-in ZigZag's extreme point indexes. Binding graphical tools requires the number of ZigZag extreme points equal to that of a selected graphical tool or more.
The Gartley patterns are created when identifying ZigZag extreme points combinations corresponding to the appropriate pattern configuration. The pattern is displayed on the chart if it suits the additional filters. The additional filters are set in the parameters.
After selecting a graphical tool, hover the cursor over the wave marking symbol or the ZigZag extreme point index. The tooltip appears. After that, we bind the graphical tool by clicking on the selected wave marking symbol or ZigZag extreme point index.
The first selected graphical tool appears on the chart together with the additional menu for editing its parameters. The menu has different configuration depending on a tool. Let's have a look at its specific elements.
The most complex additional menu is displayed for logarithmic spirals:

Spirals generated using the graphical interface as well as the ones created by selecting the parameters are saved in the appropriate archive file. All spirals can be edited only from the additional menu. All other graphical tools are saved in a different way. Graphical tools created using the graphical interface are saved in archives and edited in the additional menu. The tools created using the parameters are not saved in the archives and their configuration is edited by changing the parameters. Each chart window has its archive with graphical tools plotted in the window.
Two extreme points are necessary for displaying the spiral in order to bind its initial radius. The points should not be located on a single bar (the algorithm does not allow creating a spiral having both anchor points on a single bar). Click the right extreme point. Theoretically, four spirals can be bound to two points: with a center on the first or second extreme point and rotating clockwise or counter-clockwise.
Thus, two spirals are created simultaneously. The spiral's center is bound to the right symbol. But only the counter-clockwise rotating spiral is displayed on the chart. In his works, Robert Fischer notes that such spiral has better predictive parameters. The clockwise rotating spiral is hidden.
The arrows ![]() allow you to select a group of two spirals for editing. The info table to the right of the arrows displays the edited spiral's index and the timeframe where the spiral is generated (after the colon). When hovering the cursor over the info table, the tooltip shows you the time of creation of the bar with the first anchor point (from left to right), the bar's index and the range of timeframes that can be used to display the spiral bound to the selected extreme points.
allow you to select a group of two spirals for editing. The info table to the right of the arrows displays the edited spiral's index and the timeframe where the spiral is generated (after the colon). When hovering the cursor over the info table, the tooltip shows you the time of creation of the bar with the first anchor point (from left to right), the bar's index and the range of timeframes that can be used to display the spiral bound to the selected extreme points.

The ![]() icons allow you to select one of the two spirals to be displayed on the chart. Both spirals can be displayed simultaneously. However, only one of them can be edited. A spiral not displayed on the chart is unavailable for editing. A spiral to be edited is selected using the
icons allow you to select one of the two spirals to be displayed on the chart. Both spirals can be displayed simultaneously. However, only one of them can be edited. A spiral not displayed on the chart is unavailable for editing. A spiral to be edited is selected using the ![]() icons. All the remaining spiral editing menu buttons are activated only after a spiral is selected. Let's describe them from right to left.
icons. All the remaining spiral editing menu buttons are activated only after a spiral is selected. Let's describe them from right to left.
The ![]() buttons are used to edit a color of the spiral sectors. If a spiral is bound to the wave ZigZag's wave marking symbol, all its sectors receive the same color as the one of the wave level the selected symbol belongs to. If the wave level color is changed, the spiral color remains as it was during the spiral generation. If the spiral is bound to the built-in ZigZag's extreme point index, the spiral is colored in blue and red. The colors are taken from the spiralColor1 and spiralColor2 parameters. If the spiral is painted in a single color, it can be changed by clicking the left button. If the spiral is to be painted in two colors, it can be edited both by left and right buttons.
buttons are used to edit a color of the spiral sectors. If a spiral is bound to the wave ZigZag's wave marking symbol, all its sectors receive the same color as the one of the wave level the selected symbol belongs to. If the wave level color is changed, the spiral color remains as it was during the spiral generation. If the spiral is bound to the built-in ZigZag's extreme point index, the spiral is colored in blue and red. The colors are taken from the spiralColor1 and spiralColor2 parameters. If the spiral is painted in a single color, it can be changed by clicking the left button. If the spiral is to be painted in two colors, it can be edited both by left and right buttons.
- The
 arrows measure a spiral line width.
- The
 buttons change a spiral center binding.
- The
 buttons change the distance between turns.
- The
 buttons compress or expand a spiral horizontally.
 - The
 buttons compress or expand a spiral vertically.
 - In
 , the number of an edited spiral turns is set.
All edited spiral parameters are saved. Afterwards, the spiral is displayed on a chart with saved parameters. Spirals are removed by groups of two. Thus, we create the two spirals and delete another two since they are not related to the former ones. Press Del on the above menu to delete the spirals. All spirals are hidden by pressing Hide on the above menu.
When hovering the cursor over the spiral line, the following data is displayed in the tooltip:
- graphical tool name
- spiral index
- timeframe, on which the spiral is created
- index of the turn, above which the cursor is hovering
- range of the timeframes where the spiral can be displayed with binding to selected extreme points.
A tooltip displays data on the same spiral as the info table.

If there are several spirals on the screen, a spiral for editing/removal can be selected in different ways.
- Hover the cursor over a spiral line and remember its index in the tooltip. Use the spiral editing menu arrows to select a group including the necessary spiral.
- Hover the cursor over a spiral line and simply click the left mouse button. The group the spiral is included into is selected automatically in the editing menu.
Other graphical tools can be selected for editing the same way. However, only a graphical tool of the type selected in the menu is available for editing.
Let's consider the differences of specific elements of the additional menu for editing other graphical tools.
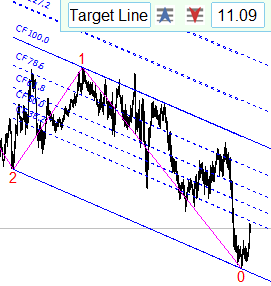
Fibonacci Channel additional menu: ![]()
- The
 button manages the location of a Fibonacci Channel target line. By default, a target line (CF 100.0) is tangential to the market. When releasing the button, the line moves through an extreme point.
- The Fibo level is selected using the
 buttons.
 - The 11.09 button containing data on an edited graphical tool Fibo level allows you to show/hide the level on the chart. You may leave a single Fibo level, while hiding the remaining ones.
- The blue square button sets a color of the channel lines.
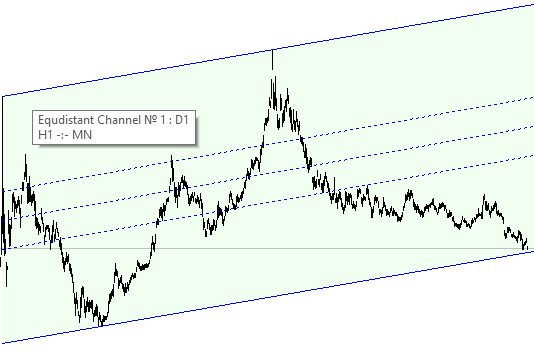
Additional menu of the equidistant channel: ![]()
- The
 buttons allow you to change the colors of the channel lines and filling.
The channel median and the equilibrium channel are additionally displayed in the equidistant channel. The equilibrium channel is limited by lines on 38.2% and 61.8% levels of the channel width. Plotting the equidistant channel for USDRUB:
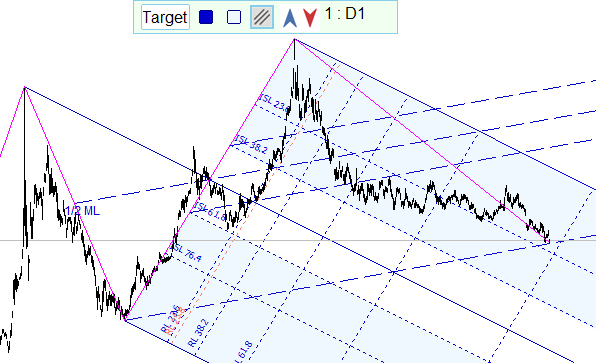
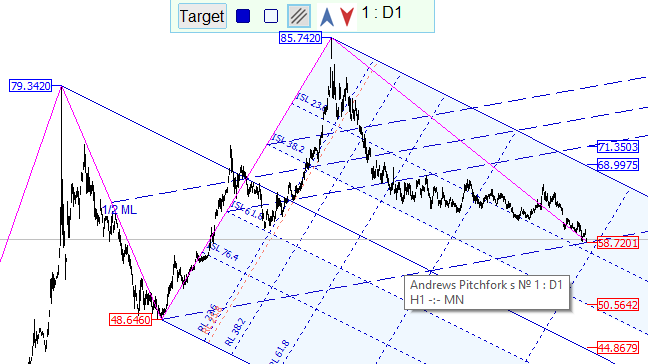
Andrews’ Pitchfork additional menu: ![]()
- The
 button shows target labels on Andrews’ Pitchfork set lines. Additional Andrews’ Pitchfork set lines can be displayed on a chart if this is necessary in accordance with location of the forks relative to the market.
Fibonacci Time Zones additional menu: ![]()
Fibo zones are bound to three extreme points.
- The
 buttons display three Fibo zones.
- The first button shows a Fibo zone bound to the first and third extreme points (from left to right).
- The second button shows a Fibo zone bound to the second and third extreme points.
- The third button shows a Fibo zone bound to the first and second extreme points.
Fibonacci Arcs additional menu: ![]()
- The
 buttons change the Fibonacci Arcs center anchor point.
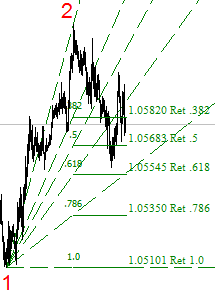
Additional menu of the Pesavento patterns: ![]()
- The
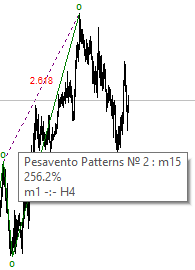
 buttons edit the colors of the pattern's connector line and text displaying a Pesavento pattern retracement pattern.
When hovering the cursor over the Pesavento pattern line or value, an accurate pattern retracement value is displayed in a tooltip:
Additional menus of other graphical tools contain the buttons similar to the functionality of the already described ones.
Let's consider some features of certain graphical tools displayed using the graphical interface.
Fibonacci projections are similar to Fibonacci Extensions in MetaTrader. I think, "Fibonacci projections" better conveys the function of the tool. Besides, it is popular among other graphical analysis systems.
Versum Levels tool is named after the nickname of the user who offered this tool on the forum. It is a version of the Fibonacci Fan. The difference is that the Fibo Fan applies two anchor (extreme) points, while the Versum Levels need three. Fan lines are drawn from the anchor point 1 via the Fibo levels on the vertical plotted from the anchor point 2 and having a base on the levels of the points 1 and 2. For Versum Levels, the fan lines are drawn from the anchor point 1 via the points of ZigZag ray crossing between the points 2 and 3 with vertical Fibo levels having a base on the levels of the anchor points 2 and 3.
The Gartley Patterns tooltip additionally displays the pattern name, for example: 
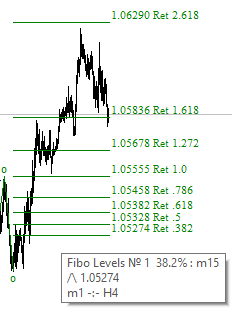
The Fibonacci Levels tooltip additionally displays the Fibo level in %, its development direction and price:
The graphical interface and the parameters
The graphical interface allows quick display of the graphical tools without configuring their look. The ZUP indicator platform features over 400 parameters. Most parameters affect the look and behavior of graphical tools displayed on the chart via the interface.
All graphical tools can be dynamic and static. Dynamic tools can only be created by using the parameters. Static tools can be created by both using parameters and the graphical interface. Put simply, the graphical tools displayed via the interface use the same parameters as static tools enabled using the parameters.
The full list of input parameters can be found in the attached file.
Conclusion
Over the past 10 years after writing the first two articles, we have implemented multiple improvements increasing the number of parameters and changing names of some of them. Working algorithms of some parameters were changed. Added a large number of functions for Andrews' Pitchfork. The algorithm of searching for the Gartley patterns has been re-written from scratch multiple times. The ability to connect via an external file for searching for the Gartley patterns has been added as well. Some traders connect more than 100 custom patterns via the file... This is only a modest and incomplete description of the work done.
In this article, we have provided a brief description of the ZUP indicator platform graphical interface.
Let's sum up the new, most important interface features.
- Added wave marking.
- A wave ZigZag is generated simultaneously when creating a wave marking.
- Ability to create and save almost unlimited number of wave markings.
- The fractal filtration automatically hides the wave marking segments and graphical tools on the timeframes with disappearing extreme points the wave marking or graphical tools symbols have been bound to.
- Added the ability to attach 12 types of graphical tools to ZigZag (including the wave one) extreme points using the mouse.
- Graphical tools created using the graphical interface are saved in the archive. After that, they can be easily displayed on the chart to analyze one's actions.
I hope, this description will help you master the new features of the ZUP indicator platform.
You can download the ZUP indicator platform on the Market: https://www.mql5.com/en/market/product/19758
References
- Robert Fischer. Fibonacci Applications and Strategies for Traders.
- Rober Fischer, Jens Fischer. The New Fibonacci Trader. Tools and Strategies for Trading Success.
- Carolyn Boroden. Fibonacci Trading.
Translated from Russian by MetaQuotes Ltd.
Original article: https://www.mql5.com/ru/articles/2966
Warning: All rights to these materials are reserved by MetaQuotes Ltd. Copying or reprinting of these materials in whole or in part is prohibited.
This article was written by a user of the site and reflects their personal views. MetaQuotes Ltd is not responsible for the accuracy of the information presented, nor for any consequences resulting from the use of the solutions, strategies or recommendations described.
- Free trading apps
- Over 8,000 signals for copying
- Economic news for exploring financial markets
You agree to website policy and terms of use
