

How to Develop a Multi-Currency Expert Advisor with the AI Assistant in MetaTrader 5
 230
 1

One Expert Advisor, several currency pairs, various trading strategies, and a unified risk management system. The task seems quite straightforward until you start looking into the details.
Let's imagine that an Expert Advisor buys both EURUSD and GBPUSD at the same time. Technically, these are two separate trades, but both depend on movements in the U.S. dollar. If the dollar starts to strengthen, losses could occur on both positions at once. So it is not enough to simply teach an Expert Advisor to trade multiple instruments — you need to account for the relationships between them, allocate risk, and manage the entire portfolio.
Developing such a system requires knowledge of MQL5, statistics, trading program architecture, and risk management. But do you really have to figure all this out on your own?

A New Era in Algorithmic Trading
Starting with build 6060, MetaTrader 5 and MetaEditor feature a built-in AI Assistant with support for the Model Context Protocol (MCP). Artificial intelligence can now not only help write code, but also compile it, fix errors, and test it. This makes it possible to approach the development of even fairly complex trading systems in a new way.
We will show you how to use these features to create a fully-fledged multi-currency Expert Advisor. Moreover, we will not set all the trading rules in advance — we will ask the AI to independently select several strategies, research them, combine them into a portfolio system, and test the result.
We'll walk through the entire development process: the actual prompts given to the assistant, its decisions, the errors encountered, the test results, and the time spent. Let's see how well AI can handle a complex task on its own and in what situations it will need our intervention.
That said, our goal is not to create a trading system that is guaranteed to be profitable. It is more important for us to get a working prototype, understand the capabilities of the new tool, and assess how much it can simplify the work of an algorithmic trader.
A Good Start
Let's start not by writing code, but by organizing our work. If we simply ask the AI to create a multi-currency Expert Advisor, it might come up with its own trading rules, choose the architecture, and make a number of decisions that we won't be happy with.
So let's agree on this right away: first, we will draw up a plan, discuss each subsequent step in advance and record all significant actions and results in the development log. Open MetaTrader 5, go to the chat section, and start a conversation with the AI Assistant. Our first request will be very brief.
Hi.

We need to write an Expert Advisor, but first we will prepare a plan. Each step must be discussed first and executed only after my approval.
After a few minutes of deliberation, we get the first response:
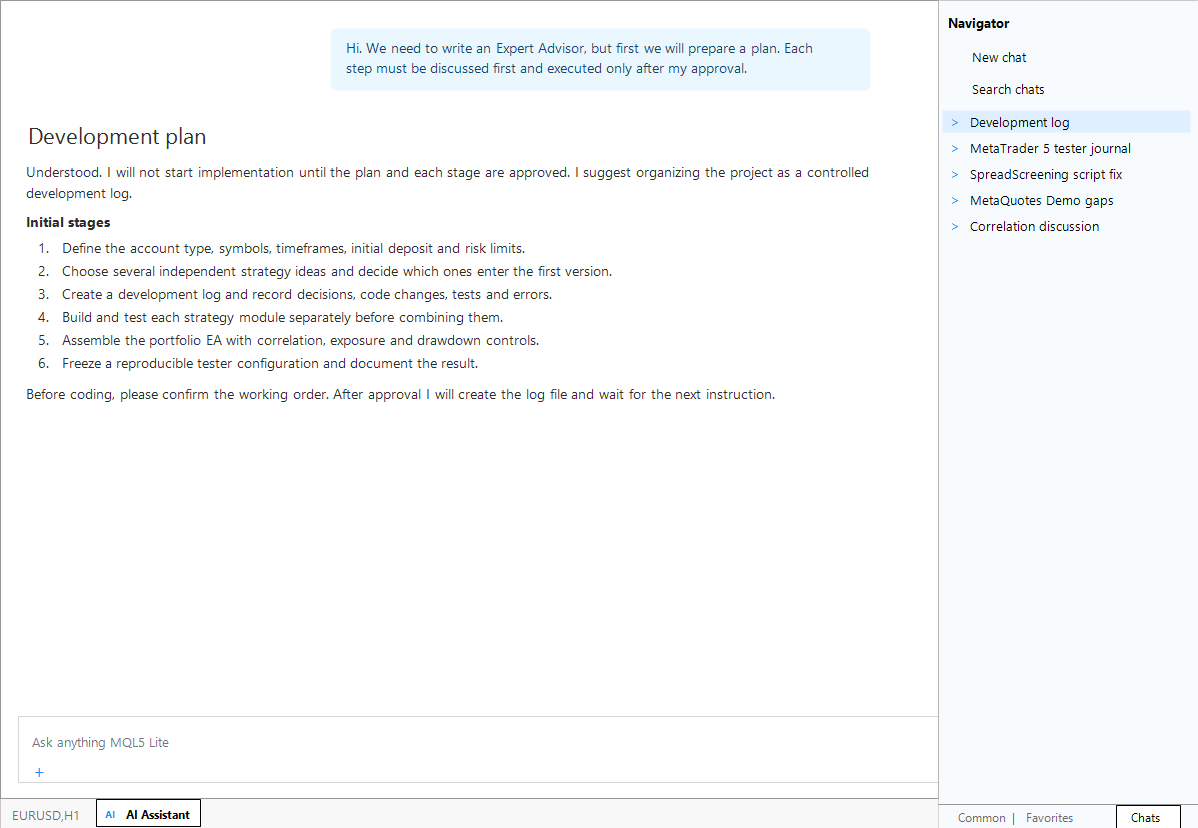
As we can see, the AI Assistant got right to work and presented a detailed, ready-to-use development plan. But we will tighten up our working procedures a bit so that we have a rigorous technical record of our work.
We will give the assistant the first set of instructions, and they are very detailed. You can draft them on your own, but it is much faster and better to write it using any modern AI model — ChatGPT, Claude, Gemini, and so on.
First, we will discuss the procedure.

Starting with this message, keep a continuous log of all significant actions taken on the project. The log is necessary for the subsequent analysis of the work done to develop a trading system using the AI Assistant.


## 1. Log file

Create a file named `DEVELOPMENT_LOG.md` in the MQL5 project directory.

If the file already exists, read it and continue the log without deleting the previous entries.

Save the log directly to disk, not just in the conversation context.

## 2. What to document

Record each significant stage:

- Defining the task and clarifying requirements.
- Designing algorithms and architecture.
- Creating and modifying source code.
- Adding new features and modules.
- Compiling and debugging.
- Identifying and correcting logical errors.
- Running tests and analyzing results.
- Optimizing and improving performance.
- Changes to requirements and technical decisions made.

Do not record every minor action. Group related operations into logical stages.

## 3. Time tracking

For each stage, record the following:

- Stage number and name.
- Start time and end time.
- Duration in minutes and seconds.
- A brief description of the actions performed.
- Files created or modified.
- Problems encountered and how they were resolved.
- The result obtained.

Use your computer's local time, specifying the time zone.

Get the actual time from an available system source. Do not make up timestamps or durations.

If you cannot determine the exact time, enter "not measured." If the duration is an estimate, clearly indicate that it is an estimate.

Distinguish between:
- The total elapsed time of the stage, including wait time for compilation and testing.
- Active working time, only if it can actually be measured.

## 4. Logging guidelines

Before starting a new significant stage, write down its name, purpose, and start time.

Once the stage is complete, immediately update the log entry with the results and end time.

If an error occurs, document its cause, the correction made, and the result of the recheck.

If the stage is not complete, leave the status as IN PROGRESS. At the next startup, check for unfinished stages.

Do not delete records of failed attempts. They are valuable for a technical article.

If a fix proves unsuccessful, record that in the history rather than replacing the original result.

For each new user request, first check the status of the log and the open stage. After completing the request, update the log before reporting completion.

## 5. Log format

At the beginning of the file, maintain a summary containing:

- Project name.
- Development start date.
- Current status.
- Number of completed stages.
- Total measured time.
- Number of compilations, errors, and test runs, if these figures are reliably known.

For each stage, use the following structure:

### Stage N. title

- Start:
- End:
- Duration:
- Purpose:
- User Request: Brief Summary
- Actions:
- Files Modified:
- Errors and Corrections:
- Verification:
- Result:
- Status: DONE / IN PROGRESS / FAILED

## 6. Check before finalizing your response

Before each message reporting the completion of significant work:

1. Make sure the log is up to date.
2. Verify that actual compilation or test results are available if compilation or testing was performed.
3. Do not mark a task as successfully completed without first verifying it.
4. Briefly report the result and the log entry.

## 7. Final report

When I write "Prepare a development report," read through the entire log and prepare a brief technical report with the following sections:

1. What problem was being solved.
2. How the architecture and trading logic were developed.
3. The main stages of development in chronological order.
4. What errors occurred and how the AI Assistant corrected them.
5. How compilation, debugging, and testing were performed.
6. What results were obtained?
7. How long did the development take overall, and how long did each major stage take?
8. What limitations or unresolved issues remain?

Add a concise table listing the stages and their durations.

The report must be factual and free of promotional language. It will serve as the foundation for improving robot development processes on MQL5.com.

## 8. Instruction priority

Treat keeping the log as a permanent working rule for this project. It applies to all subsequent stages until my explicit instruction to disable logging.

If the dialog context is shortened or a new session starts, restore the work history from DEVELOPMENT_LOG.md.

Do not rely on your own memory instead of the saved file.

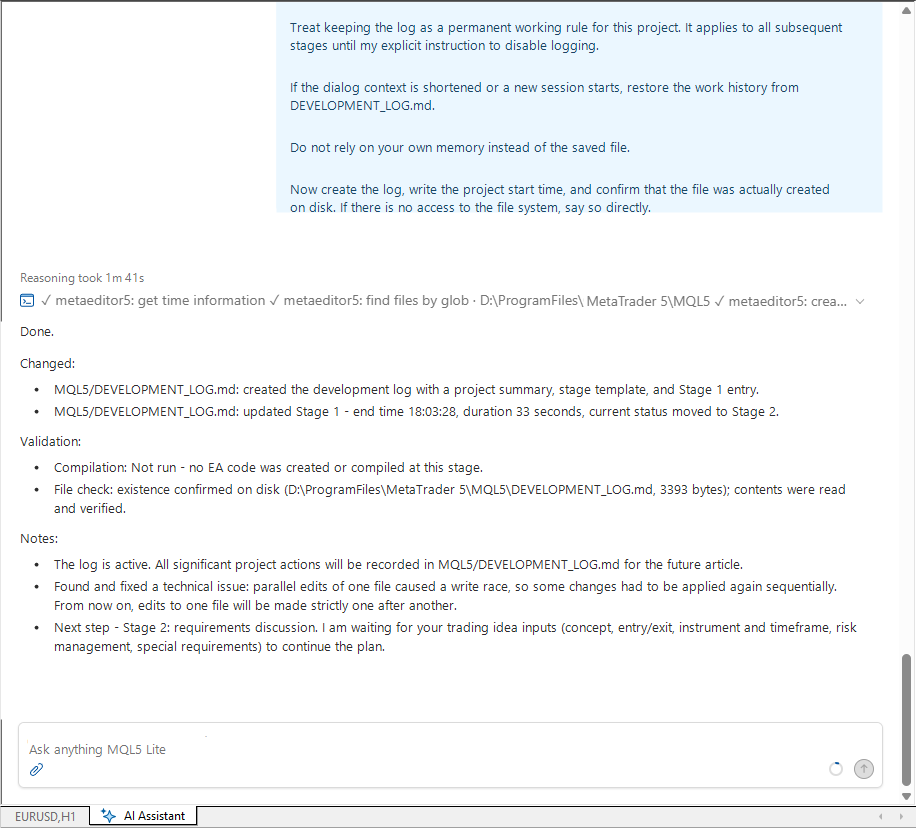
Now create the log, write the project start time, and confirm that the file was actually created on disk. If there is no access to the file system, say so directly.
The AI Assistant immediately creates a log and makes the first entries in it:
Choosing a Trading System
Modern models are vast encyclopedias covering virtually every field of knowledge. If we set clear rules for trading, we will, to some extent, limit our options. So let's ask the AI to come up with some ideas on its own—that will be a good starting point. Our goal is not to create a fully functional, profitable system on the first try, but to gain development experience and lay a solid foundation for future projects. Before AI was introduced in MetaTrader 5, this process could take days or even weeks of intensive programming in MetaEditor. Now we can do this right from the terminal, even if we have no experience with the development environment
We need to write an Expert Advisor that will trade using multiple trading strategies and multiple symbols simultaneously.

Therefore, it must take into account the correlation between instruments, allocate risk, and automatically limit the portfolio's overall exposure.
First, we need to choose our strategies. Suggest several systems based on different concepts so that trading signals are generated under different market conditions.
It is possible — and even desirable — for them to open opposing positions on the same instrument.
Here is the answer:
All right. Before we dive in, there's one critical technical point that affects the entire architecture.
Important: Opposing positions on a single instrument
- Hedging account — you can hold both a Buy and a Sell position on the same symbol at the same time. The strategies actually overlap; net exposure is calculated as the sum.
- Netting account — the second, opposite position is not opened separately; it reduces or reverses the existing one. "Opposing positions on a single instrument" are technically impossible—only a net position is possible.
Please tell me what type of account is being used (or is planned). This determines whether we create a layer of "virtual" positions (accounting for strategies within a single net position) or use actual hedging.
Candidate Strategies (Different Ideas → Different Market Regimes)
| No. | Idea | Market Regime | Entry signal | Exit | TF |
|---|---|---|---|---|---|
| S1 | Trend-following channel breakout (Donchian + ATR) | Strong trend | Bar closes outside the N-bar channel + ADX > 20 / price on the relevant side of EMA200 | SL 2×ATR, TP 3×ATR, channel-based trailing stop | H1, H4 |
| S2 | Mean reversion (Bollinger + z-score) | Flat / range-bound market | Close outside the BB(20,2) band, z-score < −2, ADX < 20 → Buy; reverse conditions for Sell | TP at the mean, SL beyond the extreme / 1.5×ATR, time-based exit | M15, H1 |
| S3 | Momentum (MACD + RSI) | A moderate trend | MACD histogram sign change + RSI crosses 50, confirmed by the close | SL 1.5×ATR, TP 2×ATR, break-even after 1×ATR | H1 |
| S4 | Volatility compression (BB inside Keltner channels) | Transition from low to high volatility | Squeeze for N bars, then a BB breakout in the direction of the exit | ATR stop, trailing stop | H1, H4 |
| S5 | Opening range breakout (Opening Range) | Intraday momentum at the London/New York open | Breakout of the range established in the first 30–60 minutes + retest | SL beyond the opposite boundary, TP 1–2R, close by the end of the session | M5, M15 |
| S6 | Relative value (spread/pairs) | Deviation of correlation from its normal level | z-score of the spread between two correlated instruments > 2 → short the overvalued one / long the undervalued one | z-score reversion to 0, SL when | z |
How they complement and "cancel each other out"
- S1 vs. S2 — opposite in nature: trend following captures continuation, while mean reversion captures pullbacks. On the same symbol, they provide a natural hedge across different market regimes.
- S3 is similar to S1 in direction (trend continuation), but enters earlier and without a level breakout — a priority rule is needed to avoid duplicate entries.
- S4 reacts to a change in market regime, not to the trend itself — it does not conflict directly with S1/S2.
- S5 is the only purely intraday, time-dependent strategy.
- S6 uses correlation itself as a trading signal and works best in conjunction with portfolio exposure management (long one instrument / short a correlated one).
Recommendation for the first version
S1 + S2 + S6 — trend, mean reversion, and relative value. Three different market regimes, naturally opposing positions, and a direct connection to the correlation layer. S3/S4/S5 — planned for the second iteration to avoid bloating the first release.
Portfolio risk layer (draft; we will discuss this separately)
- Risk per trade — % of equity → volume calculated using tick value / tick size.
- Per-symbol limit — maximum net notional exposure.
- Correlation clusters — rolling correlation (60–120 bars), instrument grouping, exposure limit per cluster.
- Total exposure — limits on gross notional exposure and margin utilization percentage.
- Signal conflict rules — strategy priorities, permitted/prohibited hedging, blocking duplicate entries.
What do I need from you to move forward?
- Account type: hedging or netting?
- Instrument set: how many and which symbols (for example, 7 major currency pairs + XAUUSD? Indices? Cryptocurrencies?)
- Timeframes: fixed or multi-timeframe logic?
- First version: S1 + S2 + S6, or another set?
- Limits: maximum spread, slippage, sessions?
- Deposit currency and initial capital — for calculating risk and margin.
Done.

Changed:
- `MQL5/DEVELOPMENT_LOG.md`: Added a log entry for Stage 2 (strategy selection) and updated the current status in the summary.

Validation:
- Compilation: Not run — no code changes.
- File check: log read, stage entry in place.

Notes:
- The strategies are currently proposed at the conceptual level; specific indicator formulas, thresholds, and rules have not yet been finalized.
- A decision on the account type (hedging/netting) is required — this is a key architectural decision point.
- Once the strategies are selected, we will move on to Stage 3: formalizing the technical specifications and input parameters.
As you can see, the AI asked follow-up questions rather than silently building an Expert Advisor as it saw fit. All of this is thanks to the introductory prompt, where we laid out our plan of action right away.
We will respond to it point by point
Answers:
1. Hedging account
2. Select 3 currency pairs with minimal correlation
3. Timeframe will be selected from M5 to H1
4. Agreed, but we first develop each strategy separately on one instrument. Then we figure out how to bring the strategies together
5. Ignore for now
6. Deposit currency is USD, starting deposit is 3000.
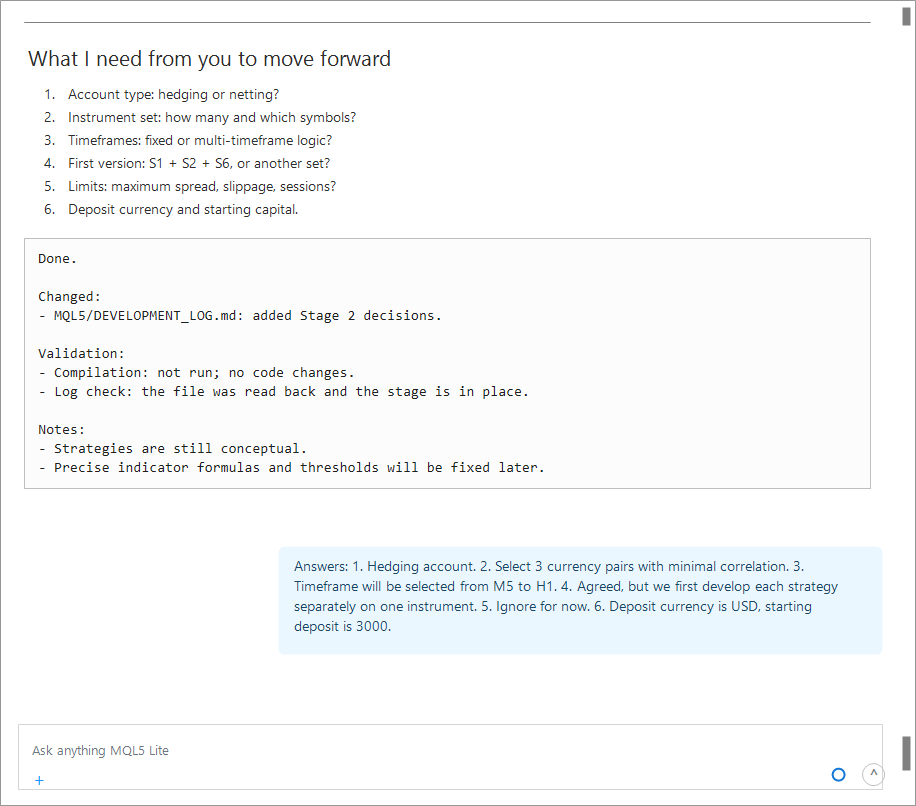
After the AI spends 4 minutes thinking, we get a response. Estimate how much time it would take you to conduct this analysis on your own. And that's assuming you have all the necessary skills in statistics and programming.
During that time, the AI requested the necessary historical data for the missing symbols from MarketWatch.
- It wrote a script to calculate correlations.
- It compiled a report based on the resulting data and selected the symbols with the lowest mutual correlation.
- It suggested deferring strategy S6 until Stage 5.
Done. I documented the decisions and performed a correlation analysis based on actual data, rather than "by eye."
Agreed project requirements
- Hedging account (I will verify the account type on the first run).
- 3 pairs with minimal correlation, M5–H1, phased development, USD 3,000 deposit.
- We are not limiting the spread/slippage at this time.
How correlation was calculated
The CorrelationMatrix.mq5 diagnostic script was written: log returns of Close prices, Pearson's correlation coefficient, D1, 500 bars (2024-12-03 … 2026-11-05), 12 symbols. An additional cross-check was run on H1/500 (~1 month).
Key values for D1/500:
| Pair | corr |
|---|---|
| AUDUSD – NZDUSD | 0.872 |
| EURJPY – GBPJPY | 0.841 |
| EURUSD – USDCHF | −0.829 |
| EURUSD – GBPUSD | 0.809 |
| USDJPY – USDCAD | 0.411 |
| EURGBP – GBPJPY | −0.375 |
| EURGBP – USDCAD | −0.064 |
| GBPJPY – USDCAD | −0.026 |
The best triplets by the criterion "lowest maximum |corr| within the triplet":
| # | Triplet | max abs corr | avg abs corr |
|---|---|---|---|
| 1 | NZDUSD / EURGBP / EURCHF | 0.040 | 0.022 |
| 2 | USDCAD / EURGBP / EURCHF | 0.089 | 0.051 |
| 3 | AUDUSD / EURGBP / EURCHF | 0.111 | 0.059 |
Selection: EURGBP + USDCAD + GBPJPY
| Pair | D1/500 | H1/500 | Spread (current) |
|---|---|---|---|
| EURGBP – USDCAD | −0.064 | −0.001 | 1 point |
| GBPJPY – USDCAD | −0.026 | −0.154 | 7 points (0.7 pips) |
| EURGBP – GBPJPY | −0.375 | −0.151 | — |
Why not choose the purely statistical minimum (0.040)? That triplet — NZDUSD, EURGBP, and EURCHF — consists of instruments with similar characteristics: low volatility and predominantly range-bound markets. The trend-following strategy (S1) has no room to operate there, and the whole idea of "different market conditions" is lost.
The selected triplet offers three distinct market profiles with a maximum |corr| of 0.375 (compared to 0.8+ for the standard major currency pairs):
- EURGBP — low volatility, range-bound market → basis for S2 (mean reversion).
- GBPJPY — high volatility, strong trends → basis for S1 (trend breakout).
- USDCAD — moderate volatility, commodity-driven, almost uncorrelated with the other two.
Correlations are unstable over time: 0.375 reflects the current regime, not a constant. Therefore, a dynamic correlation layer will still be needed in the portfolio component; a static matrix is not sufficient.
An important implication for S6
Relative value, by definition, involves trading the spread between correlated instruments. The triplet is intentionally uncorrelated, so S6 will not be run on it. Options to choose from later:
- add a fourth symbol (for example, a currency pair correlated with USDCAD) specifically for S6;
- implement S6 as a synthetic spread (for example, EURGBP against the EURUSD/GBPUSD ratio);
- replace S6 with another single-instrument strategy.
This is a decision for Stage 5; we will come back to it after S1/S2. I am just making a note of this so there will not be any surprises.
Changes to the Terminal
The symbols USDJPY, USDCHF, USDCAD, NZDUSD, EURGBP, EURJPY, GBPJPY, EURCHF, AUDUSD, and AUDJPY have been added to Market Watch (hidden, not displayed) — otherwise, the terminal would not provide the historical data and the script would freeze. No trading activities were carried out.
Next Step — Stage 4
I suggest starting with S1 (trend breakout) on GBPJPY: define the entry and exit rules, indicator settings, and filters, and select a timeframe between M5 and H1 using the backtester. I am waiting for confirmation — I am not writing the code yet.
Done.

Changed:
- `MQL5/Scripts/DevTools/CorrelationMatrix.mq5`: created a diagnostic correlation script.
- `MQL5/DEVELOPMENT_LOG.md`: closed Stage 2; added and completed Stage 3 with actual results.

Validation:
- Compilation: 0 errors, 0 warnings (`CorrelationMatrix.mq5`).
- Script executed, result read from Experts log: 12 symbols × 500 daily bars, all symbols have 499–500 bars.

Notes:
- Correlations depend on the market regime; a static matrix is not enough for the portfolio layer.
- S6 is incompatible with an uncorrelated trio; it needs a decision at Stage 5.
- A backtest does not guarantee future returns; tester results are only a logic check.
We give the go-ahead, and AI Assistant continues its work.
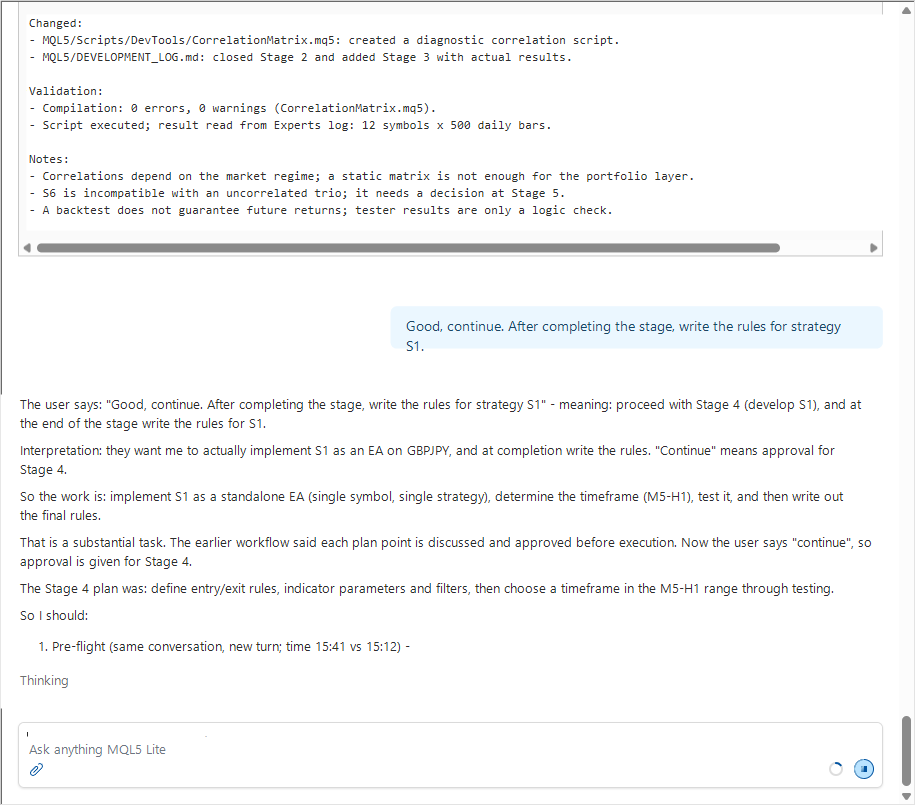
The AI writes the Expert Advisor code itself, runs backtests on different timeframes, and draws a preliminary conclusion.
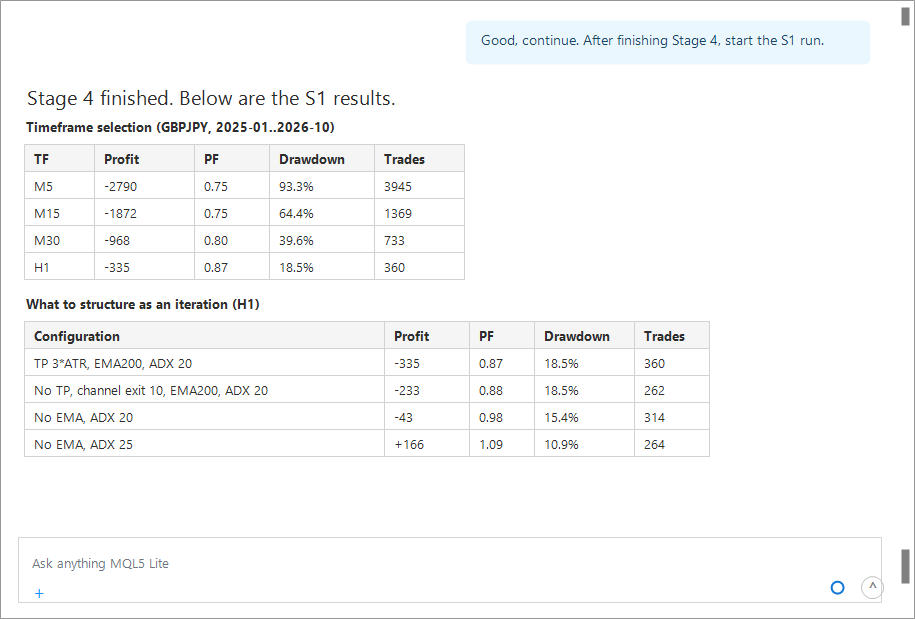
Stage 4 is complete. Below are the results and rules for S1.
Timeframe selection (GBPJPY, Initial Deposit USD 3,000, January 2025–October 2026)
First version: 20-period channel, ADX ≥ 20, EMA200, SL 2×ATR, TP 3×ATR.
| TF | Profit | PF | Drawdown | Trades |
|---|---|---|---|---|
| M5 | −2,790 | 0.75 | 93.3% | 3945 |
| M15 | −1872 | 0.75 | 64.4% | 1369 |
| M30 | −968 | 0.80 | 39.6% | 733 |
| H1 | −335 | 0.87 | 18.5% | 360 |
The metrics improve monotonically as the timeframe increases. H1 is the only candidate.
What the structural iteration achieved (H1)
| Configuration | Profit | PF | Drawdown | Trades |
|---|---|---|---|---|
| TP 3×ATR, EMA200, ADX 20 | −335 | 0.87 | 18.5% | 360 |
| No TP, exit via the 10-period channel, EMA200, ADX 20 | −233 | 0.88 | 18.5% | 262 |
| Without EMA, ADX 20 | −43 | 0.98 | 15.4% | 314 |
| Without EMA, ADX 25 | +166 | 1.09 | 10.9% | 264 |
| Without EMA, ADX 30 | +434 | 1.32 | 5.4% | 201 |
| Without EMA, ADX 35 | +205 | 1.22 | 6.9% | 145 |
Two conclusions: the fixed TP did indeed "cut into" profits, and the EMA200 filter was counterproductive (it lagged and filtered out entries).
Out-of-sample testing
The ADX 30 configuration yielded +434 for 2025–2026, but for 2023–2024 it yielded −289, PF 0.84. This is a sign of overfitting to that period. Full backtest for 2023–2026 with a neutral ADX of 25: −138 USD, PF 0.966, drawdown 24.7%, 584 trades. The M1 OHLC model yielded the same result (−138.91) — this cannot be explained by a tester artifact.
Conclusion: In its current form, S1 has no confirmed statistical edge on GBPJPY. As a portfolio component, it is acceptable (low correlation with future S2/S6), but it is not ready for live trading.
S1 Strategy Rules v1.0
Instrument: GBPJPY. Timeframe: H1.
Indicators: 20-period Donchian channel (entry), 10-period Donchian channel (exit), ATR(14), ADX(14).
Entry (once per bar, based on the closed bar; bar 0 is the current, unclosed bar):
- Buy: Close[1] > max(High[2..21]) AND ADX[1] ≥ 25
- Sell: Close[1] < min(Low[2..11]) … or, more precisely, min(Low[2..21]) AND ADX[1] ≥ 25
- The channel is constructed using bars 2 through 21 — the signal bar is not included in its own breakout level.
- No EMA filter is used (tested and found to be detrimental).
Exit:
- Stop-loss: 2.0 × ATR[1] from the entry price; set immediately.
- Take-profit: None.
- Reversal exit: A long position is closed when Close[1] < min(Low[2..11]), and a short position is closed when Close[1] > max(High[2..11]).
- Trailing stop: optional, disabled by default; when enabled, the trailing distance is 1.5 × ATR, with an adjustment increment of 0.5 × ATR.
Position size:
- Risk 0.5% of equity per trade.
- lot = risk / ((SL distance / tick_size) × tick_value), rounded down to the nearest volume increment, subject to min/max limits.
- One position per symbol+magic combination; no opposing positions are opened within S1.
Safety checks: trading permissions for the terminal/account/Expert Advisor, symbol trading mode, stop level, freeze level when adjusting the trailing stop, and price normalization to the tick size.
Default parameters:
| Parameter | Value |
|---|---|
| InpChannelPeriod | 20 |
| InpExitChannelPeriod | 10 |
| InpATRPeriod | 14 |
| InpADXPeriod | 14 |
| InpADXMin | 25 |
| InpSL_ATR | 2.0 |
| InpTP_ATR | 0 (off) |
| InpEMAPeriod | 0 (off) |
| InpTrailATR | 0 (off) |
| InpRiskPercent | 0.5 |
| InpMagic | 20261105 |
Rule status: Implemented and compiled, but a statistical edge has not been confirmed. Live trading is not recommended until further refinements have been made.
Next step — Stage 5: S2 (mean reversion) on EURGBP. Let me know whether to proceed, and I will finalize the S2 specification before implementation.
Done.

Changes:
- `MQL5/Experts/S1_TrendBreakout.mq5`: Created the S1 Expert Advisor (Donchian, ADX, ATR stops, channel exit, risk management).
- `MQL5/Profiles/Tester/*.ini`, `*.set`: configurations and parameter sets for 14 test runs.
- `MQL5/DEVELOPMENT_LOG.md`: Stage 4 added and completed; summary updated.

Validation:
- Compilation: 0 errors, 0 warnings (4 S1 builds).
- Backtests: 14 test runs; results are shown in the tables above; out-of-sample performance is negative.

Notes:
- Correlations and results depend on the time period; a single test run does not prove an edge.
- ADX 30 (+434) did not pass out-of-sample testing — it cannot be used as a "working" parameter.
- S1 is suitable only as a portfolio component; further refinement and a forward test are required before live trading.
We give the go-ahead and ask for a justification of the choice of EURGBP.
Yes, continue in the same way. Provide an overview of the S2 strategy and explain why you chose EURGBP for it.
The screenshot shows charts of the symbols used in testing.
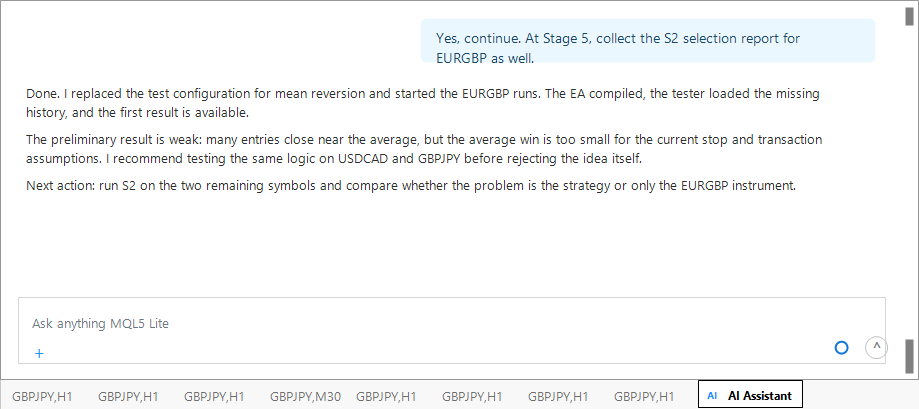
A few minutes later, we receive a response that not only includes a mathematical calculation but also mentions economic factors that could affect trading.
There is a lot of math involved; to really understand it, we would need to go over it in detail in a separate chat. If you would like. But as promised, AI can give you ideas that you would not easily come up with on your own.
The proposed strategy does not guarantee a profit, but it is significantly more sophisticated than most simple systems based on rules that have not been statistically validated.
Stage 5 is complete. The rationale is based on measurements, not general statements.
The idea behind S2 is mean reversion
S2 trades against an overextended move in the absence of a trend: the price deviates from the local mean and is statistically likely to revert, while the ADX filter excludes instances where the deviation marks the start of a trend rather than noise.
The key difference from S1:
| S1 | S2 | |
|---|---|---|
| Market Conditions | trend, ADX ≥ 25 | range-bound market, ADX < 20 |
| Entry Direction | in the breakout direction | against the overextended move |
| Exit | on a channel reversal | on mean reversion |
| Characteristics | rare, large profits | frequent small profits |
The ADX filters for these strategies are mutually exclusive — they should not generate signals simultaneously on the same instrument. This is precisely what leads to "opposing positions" during integration.
Methodology
The RegimeStatistics.mq5 script was written to calculate the following over 10,000 H1 bars: average ADX, the proportion of bars with ADX < 20, return autocorrelation (lag 1), variance ratio VR(2/5/10), efficiency ratio (10), ATR, and spread.
What the metrics mean:
- VR < 1 — variance grows less than linearly, indicating mean reversion; VR > 1 indicates trending behavior.
- Efficiency ratio — the ratio of "net movement" to "distance traveled"; the lower the ratio, the more erratic and sideways the movement.
- Proportion of time with ADX < 20 — how much time the instrument spends in a weak trend.
Results (H1, 10,000 bars)
| Metric | EURGBP | GBPJPY | USDCAD | EURUSD |
|---|---|---|---|---|
| ADX (average) | 29.13 | 29.76 | 30.37 | 29.96 |
| Time with ADX < 20, % | 23.3 | 19.3 | 17.2 | 19.5 |
| Autocorrelation (lag 1) | −0.0295 | −0.0300 | −0.0435 | −0.0126 |
| VR(2) | 0.971 | 0.970 | 0.957 | 0.988 |
| VR(5) | 0.931 | 0.947 | 0.916 | 0.958 |
| VR(10) | 0.911 | 0.923 | 0.918 | 0.963 |
| Efficiency ratio (10) | 0.3073 | 0.3201 | 0.3224 | 0.3272 |
| H1 ATR, points | 56.8 | 258.4 | 115.8 | 121.7 |
| ATR, % of price | 0.0682 | 0.1214 | 0.0829 | 0.1085 |
| Spread, points | 2 | 6 | 1 | 1 |
| Spread / ATR, % | 3.5 | 2.3 | 0.86 | 0.82 |
Why EURGBP
- The most time spent in a range-bound market — 23.3% of bars with ADX < 20, compared to 17–19.5% for the others. This is exactly the state in which S2 is permitted to operate.
- The lowest efficiency ratio (0.3073) indicates the least linear price movement; the price tends to retrace more often than it continues in the same direction.
- The lowest VR(10) = 0.911 — over a 10-hour horizon, deviations tend to diminish statistically.
- Lowest volatility — 0.068% of the price per hour. Mean reversion calls for a narrow, choppy range, not large price swings.
- A cross pair without the dollar — less dependence on the USD factor, which helps reduce correlation with S1 on GBPJPY.
Honest counterarguments
- Trade Cost. The EURGBP spread is 2 points with an ATR of 56.8 points, which is 3.5% of the ATR — the worst figure out of the four. For USDCAD, the spread is just 0.86% of ATR. This means the target should be at least ~0.5–1 ATR; otherwise, the spread will wipe out the edge. Frequent scalping on the EURGBP pair is not recommended.
- USDCAD is no worse on some metrics: its autocorrelation of −0.0435 and VR(5) of 0.916 are even stronger. However, it has a higher ER, spends less time in a range-bound market (with more trending episodes driven by oil prices and Bank of Canada meetings), and is reserved for S6.
- Risk of event-driven gaps. Political developments in the EU and UK can cause rare but wide gaps — an ATR-based stop may be subject to slippage.
- A prolonged trend (GBP under pressure) — a counter-trend strategy will result in mounting losses, so a strict stop-loss and an ADX filter are essential.
Proposed S2 specification (draft)
- Instrument: EURGBP. Timeframe: M15–H1, selected based on testing.
- Signal: z = (Close − SMA(20)) / StdDev(20).
- Long: z[1] ≤ −2.0 and ADX(14)[1] < 20.
- Short: z[1] ≥ +2.0 and ADX(14)[1] < 20.
- Target: SMA(20) at the time of entry (z → 0).
- Stop: 2.0 × ATR(14) from the entry.
- Time-based exit: Close the position after N bars (24) if neither the target nor the stop-loss has been triggered.
- Risk: 0.5% of equity; one position per symbol–magic number combination.
I am waiting for confirmation of the specification — after that, I will implement S2 following the same process as S1: a separate Expert Advisor, compilation, backtesting on M15/M30/H1, out-of-sample testing, and then the rules.
Done.

Changes:
- `MQL5/Scripts/DevTools/RegimeStatistics.mq5`: Created a script to measure the market regime.
- `MQL5/DEVELOPMENT_LOG.md`: Added and closed Stage 5; updated the summary.

Validation:
- Compilation: 0 errors, 0 warnings.
- The script was run on 4 symbols using 10,000 H1 bars per symbol; the data was read from the Experts log.

Notes:
- EURGBP has the worst spread-to-ATR ratio (3.5%) — this is the main limitation; targets of less than 0.5 ATR are not allowed.
- The regime metrics are unstable over time; the instrument selection has been confirmed for the current period and needs to be rechecked across other windows.
- The strategy code has not been written yet — the specification must be confirmed first.
We give the go-ahead to continue development
AI is writing code in MetaEditor somewhere behind the scenes; we don't even see this work happening. It then runs the Expert Advisor it has written on different timeframes in sequence in the Strategy Tester.
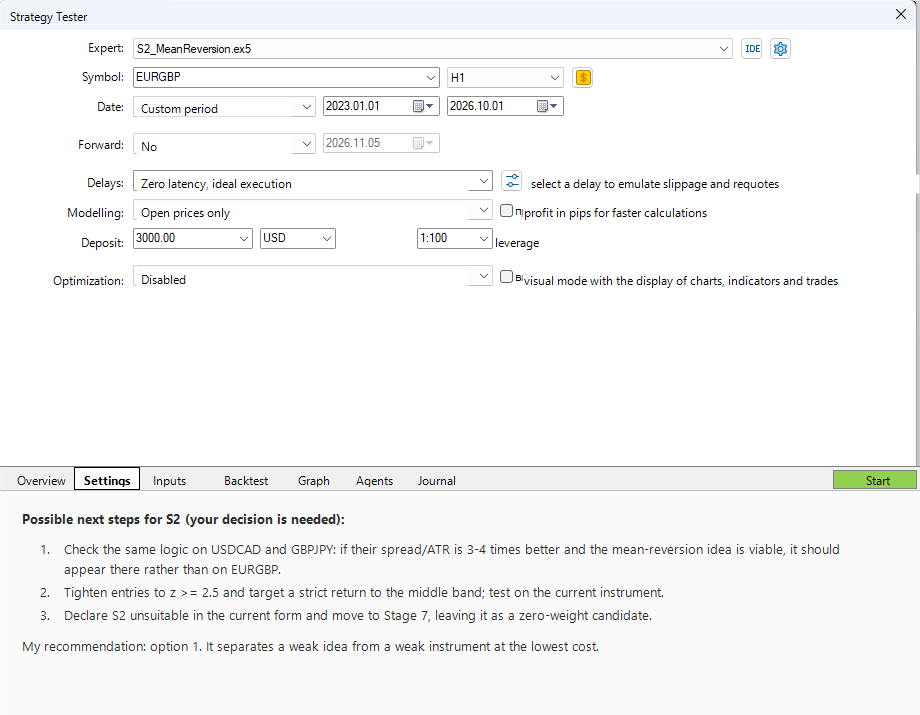
During the process, the connection to MetaEditor was lost. Once the connection was restored, the results were obtained.
Interestingly, the AI honestly gives a negative verdict for the S2 strategy on EURGBP. In other words, it does not just write code and test it — it also offers criticism.
Verified: compilation was successful. The file MQL5\Experts\S2_MeanReversion.ex5 was created (45,014 bytes, build time 18:07:40); the terminal reads its metadata (version 1.00, compiler build 6296, 19 parameters, 15 inputs) and runs it in the tester. The metaeditor5__* tools were never registered in the session, so I didn't see the compiler output or warnings — the success of the build was confirmed by the presence and functionality of the .ex5 file.
I ran all 5 planned configurations (EURGBP, 3,000 USD deposit, 1:100 leverage, "open prices" model, 0.5% risk, default parameters):
| TF | Period | Trades | Profit, USD | PF | Balance Drawdown |
|---|---|---|---|---|---|
| M5 | January 1, 2025–October 1, 2026 | 1157 | −2,328.85 | 0.4196 | 77.82% |
| M15 | January 1, 2025–October 1, 2026 | 412 | −694.27 | 0.7010 | 30.70% |
| M30 | January 1, 2025–October 1, 2026 | 284 | −150.33 | 0.9119 | 12.08% |
| H1 | January 1, 2025–October 1, 2026 | 170 | +88.79 | 1.0973 | 7.10% |
| H1 out-of-sample | January 1, 2023–December 31, 2024 | 194 | −43.96 | 0.9624 | 5.08% |
| H1 full period | January 1, 2023–October 1, 2026 | 367 | +52.10 | 1.0249 | 7.30% |
Conclusion on S2: The edge has not been confirmed.
- The timeframe acts as a transaction cost filter: M5 → M15 → M30 → H1 yield PF values of 0.42 → 0.70 → 0.91 → 1.10. The logic is simple: with an ATR of 56.8 points for EURGBP (H1) and a spread of ~2 points, any target smaller than 0.5×ATR is eaten up by the spread; on M5, there are 1,157 trades, and each one incurs an entry/exit cost.
- H1 in the 2025–2026 sample is positive, but the 2023–2024 OOS is negative, and the full backtest yields a profit of +52 USD across 367 trades — this is noise, not an edge. The observation is the same as with S1: I won't tune the parameters to fit the profitable period, as that would lead to overfitting.
- No parameter tuning was performed; a minimum target of 0.5 ATR served as protection against scalping, but this is only a reprieve, not an edge.
The log has been updated: added the subsection "Stage 6. Compilation and Tester Runs" (18:08:00–18:09:13, 5 runs, results table, conclusion); Stage 6 is marked as DONE, and attempt 2 is marked as SUPERSEDED. Summary: 6 stages completed, 8 compilations, 19 tester runs, total time: 21 hours 00 minutes 48 seconds.
Options for next steps on S2 (your decision is needed):
- Test the same logic on USDCAD and GBPJPY — their spread-to-ATR ratio is 3–4 times better, and if the "mean reversion" idea works, it will show up there rather than on EURGBP. That is about 2 runs on H1 + OOS.
- Allow entries only when z ≥ 2.5, set the target strictly at the mean with no partial exits, and add a volatility filter; check whether PF improves consistently across both periods.
- Accept that S2 is unsuitable in its current form and proceed to Stage 7 (S6 / integration), leaving S2 in the portfolio only as a candidate with zero weight.
I recommend option 1 — it is the cheapest way to distinguish a "bad idea" from a "bad instrument."
We agree to additional checks
During testing, we see an encouraging chart for GBPJPY on the H1 timeframe.
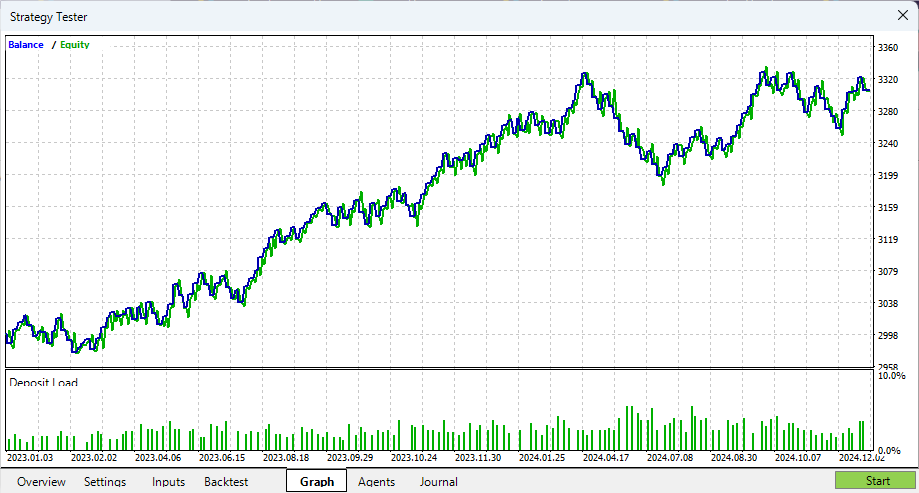
But the AI's verdict is disappointing:
I checked. Conclusion: The sign reverses for all three instruments — there is no stability.
All runs used H1, default S2 parameters (z-entry 2.0, ADX < 20, SL 2×ATR, time stop 24 bars), and 0.5% risk, without parameter tuning:
| Symbol | 2025–2026 | PF | 2023–2024 (OOS) | PF | 2023–2026 (full) | PF | Trades | Drawdown |
|---|---|---|---|---|---|---|---|---|
| EURGBP | +88.79 | 1.0973 | −43.96 | 0.9624 | +52.10 | 1.0249 | 367 | 7.30% |
| USDCAD | −67.65 | 0.9106 | +306.31 | 1.3261 | +249.30 | 1.1401 | 278 | 5.37% |
| GBPJPY | +107.37 | 1.1682 | −51.44 | 0.9345 | +58.51 | 1.0415 | 257 | 3.91% |
What does this imply?
- For all three symbols, the profit sign changes when the period changes: EURGBP and GBPJPY are positive in 2025–2026 and negative in 2023–2024, while for USDCAD, it is exactly the opposite (negative in the recent period, PF 1.33 in OOS). No instrument has the same profit sign across the two periods.
- The full 2023–2026 runs are positive for all three instruments, but with a PF of 1.02–1.14 across 257–367 trades and an expected result of +0.14 to +0.90 USD per trade — statistically indistinguishable from zero. The result is determined by which data window had the greater impact, not by the instrument's properties.
- The hypothesis that "the idea works, but the instrument is unsuitable" was not confirmed: EURGBP, with its worse spread/ATR ratio, performed no worse than USDCAD, with its better ratio. So, it is not about the instrument or the timeframe, but about the logic itself: an entry at an extreme z-score on a closed bar does not provide enough of an edge to cover transaction costs.
- To be clear about the limitations: these tests used the "open prices" model, with no slippage or commission; switching to real ticks is likely to worsen S2's results, since it trades frequently and against the price move.
The log has been updated: added the subsection "Stage 6. Extended S2 testing on USDCAD and GBPJPY" (18:21:00–18:22:19, 6 runs, table covering three symbols, conclusion); the summary (25 tester runs, total time 21 h 02 min 07 s) and current status have been updated. Six configurations — S2_USDCAD_H1*.ini and S2_GBPJPY_H1*.ini — have been created.
Options for next steps (your decision is needed):
- Close out S2 as a standalone strategy. Record the S2 rules in the log as "specification + reason for rejection," assign a weight of 0 in the portfolio, and proceed to Stage 7 (S6 / integration). Fast and honest.
- One controlled attempt to improve S2 without overfitting: z-entry 2.5, entry only when ATR is rising, target at the mean plus a fixed rule for moving the stop to break-even; test on all three symbols and both periods using a single set of parameters. That's about 9 runs and a check to see whether PF improves consistently.
- Change the S2 concept to "reversion after a false band breakout" (entry when the price actually returns inside the band, rather than when it touches it), which avoids entering against the price move in a trending market.
I recommend option 1 and suggest postponing the improvements (2–3) until the portfolio is assembled: right now, we only have S1 and S2, and neither has been validated — it is more important to find out whether we have a working strategy at all before spending effort on fine-tuning it.
Let's not argue — the AI is most likely right — so we're temporarily setting aside the S2 strategy and moving on to Stage 7: developing S6 and integrating the resulting strategies.
We can see that there are some temporary issues with automatically compiling the script that was written.
I recorded the decision on S2 and started Stage 7.
1. S2 is closed (Option 1)
A section has been added to the log titled "S2. Strategy rules (final specification and reason for rejection)": the complete rules (z ≥ 2 based on BB(20,2), σ derived from the bands, ADX(14) < 20, target at the middle band with a minimum distance of 0.5×ATR, stop 2×ATR, time stop 24 bars, risk 0.5%, Magic 20261106) and the quantitative reason for rejection — a table of all 9 runs and the conclusion that the result changes sign between periods for all three instruments. The weight of S2 in the portfolio is 0.
2. Stage 7 has begun: what to use instead of the uncorrelated triplet for S6
Of the three options, "a fourth correlated instrument — a trading pair" was selected: a synthetic spread within a single symbol cannot be tested in the tester, whereas a pair of two actual orders can be fully tested and is compatible with your hedging account. The candidates were selected from Stage 3 measurements: EURUSD/GBPUSD (|corr| 0.809), AUDUSD/NZDUSD (0.872), EURUSD/USDCHF (−0.829), EURJPY/GBPJPY (0.841), plus EURGBP/EURCHF.
A screening script has been created: MQL5\Scripts\DevTools\SpreadScreening.mq5 (10,228 bytes; reads data only; does not execute any trades). For each pair, it calculates:
- the correlation of log returns across the entire sample and separately across the two halves (to verify that the relationship has not broken down over time);
- OLS beta for the hedged ratio;
- the ratio's log spread, its AR(1) persistence, and its spread reversion half-life;
- the proportion of bars with |z| ≥ 2 and the average spread reversion after 1, 3, 5, 10, or 20 bars following the event (in units of standard deviation);
- the transaction costs of the two legs in the same units and the cost_to_sd ratio.
Pair selection criteria for S6 (I am setting these in advance to avoid overfitting later): stable correlation in both halves, a half-life of 5–50 bars, cost_to_sd < 0.25, and positive spread reversion over horizons of 5–20 bars.
Blocker: The MetaEditor 5 compiler is still unavailable in this session (compile_file is unavailable), so the script has not yet been compiled. Please press F7 once in MetaEditor for Scripts\DevTools\SpreadScreening.mq5 — then I will run it myself from the chart, read the output in the Experts log, and select a pair.
Remaining substeps of Stage 7 (pending approval after screening):
- 7.2 S6 specification: entry based on the hedged spread's z-score, exit on mean reversion, a stop on further spread widening, a time limit, and a half-life constraint — and a mandatory rule: no more than one open pair, with checks to ensure that both legs are opened and closed synchronously.
- 7.3 S6_RelativeValue.mq5 Expert Advisor: two legs, second-leg volume calculated from beta and tick value, total risk per trade ≤ 1% of equity, a magic number for each leg, and protection against one leg being left unpaired.
- 7.4 Tests: M15 and H1, 2025–2026, followed by out-of-sample testing on 2023–2024 and testing over the full period; success requires a profit in both periods and a test cost_to_sd no worse than the measured value.
If F7 is not available, let me know, and I will prepare a "portfolio shell before S6" option: I will build a multi-symbol framework with a correlation layer and exposure limits, with S6 added later as a module.
Open MetaEditor and press F7
Suddenly, the connection to MetaEditor is restored, and the AI continues
I found a flaw in my own metric (using a sum instead of an average and including overlapping bars) — I am fixing the script and rerunning it.
Stage 7 is complete. S6 was rejected based on predefined criteria — the justification is quantitative.
First, an important operational note: the metaeditor5 tools are available again, so I compiled it myself — SpreadScreening.mq5 compiled with 0 errors and 0 warnings (build 6296, AVX2); further iterations no longer require pressing F7.
What was measured (13 measurements: 5 pairs × H4/H1, 4 pairs × D1)
| Pair | TF | corr (full sample / earlier half / later half) | β | φ (AR1) | half-life | rev20 |
|---|---|---|---|---|---|---|
| EURUSD/GBPUSD | H4 | 0.803 / 0.809 / 0.797 | 0.780 | 0.9987 | 521 bars | 0.31 sd |
| EURUSD/USDCHF | H4 | −0.746 / −0.675 / −0.812 | −0.668 | 0.9952 | 146 bars | 0.52 sd |
| EURJPY/GBPJPY | H4 | 0.874 / 0.901 / 0.823 | 0.825 | 0.9987 | 536 bars | 0.30 sd |
| AUDUSD/NZDUSD | H4 | 0.872 / 0.890 / 0.854 | 0.859 | 1.0000 | not stationary | 0.15 sd |
| EURGBP/EURCHF | H4 | 0.118 / 0.158 / 0.073 | 0.099 | 0.9979 | 336 bars | 0.37 sd |
| EURUSD/GBPUSD | H1 | 0.839 / 0.849 / 0.827 | 0.769 | 1.0001 | not stationary | 0.18 sd |
| EURUSD/USDCHF | H1 | −0.804 / −0.822 / −0.780 | −0.650 | 0.9989 | 628 bars | 0.29 sd |
| EURUSD/GBPUSD | D1 | 0.711 / 0.656 / 0.807 | 0.590 | 0.9935 | 106 days | 0.66 sd |
| EURJPY/GBPJPY | D1 | 0.773 / 0.690 / 0.873 | 0.674 | 0.9972 | 243 days | 0.35 sd |
| AUDUSD/NZDUSD | D1 | 0.883 / 0.898 / 0.865 | 0.884 | 0.9989 | 604 days | 0.47 sd |
Conclusion
- On the H1 and H4 timeframes, φ = 0.9985–1.0001: the spread of the hedged ratio is essentially a random walk, with a half-life of 146 bars or more. Classic z-score-based relative value trading has no statistical basis on intraday timeframes.
- Transaction costs are not to blame here: cost_to_sd ≤ 0.003 — the cost of the two legs is negligible relative to the variability of the spread. The limiting factor is the lack of mean reversion, not the cost.
- On D1, mean reversion emerges, but the half-life is 106–604 days, implying holding periods of weeks and months; moreover, the correlation is unstable across the two halves (0.656 versus 0.807). This is a different product — a position-trading pair — outside the agreed M5–H1 range.
- The decision not to create the S6 Expert Advisor was deliberate: not a single pair passed the filter, so writing it would have meant testing a design already known to be unworkable.
Errors found and corrected along the way
- In version 1.00, the reversion metric was calculated as a sum without dividing by the number of observations and counted every bar in the episode, rather than only new threshold crossings — it yielded −13 sd (nonsense). Fixed: averaging across horizons + counting only transitions from outside the threshold to inside.
- MathSign is not defined in MQL5 (undeclared identifier) and has been replaced with an explicit condition.
- The check beta <= 0.05 rejected negatively correlated pairs (EURUSD/USDCHF); it was changed to use the absolute value of β.
- For D1, there was no historical data for USDCHF/EURJPY/EURGBP/EURCHF/NZDUSD (CopyClose → −1) — I loaded the daily bars, and the measurements were completed.
- To be transparent about an incident: when I overwrote SpreadScreening.mq5, I erased your manual edit (the MathSign replacement mentioned above). The edit has been explicitly restored, with no change in meaning.
Log: Stage 7 has been fully recorded (18:27:00–18:45:54, 18 min 54 sec, measurement table, all five errors, conclusion), status: DONE. Summary: 7 stages completed, 9 compilations, total time 21 hours 22 minutes 56 seconds.
Stage 8 — your decision is needed. Right now, we have zero confirmed strategies, and that is the key fact. Options:
- 8A — portfolio framework. A multi-symbol Expert Advisor: a registry of strategy modules, risk per trade, a per-symbol limit, rolling correlation clusters, gross notional exposure and margin percentage, and priorities for conflicting signals. The engineering foundation for everything that follows; S1/S2 are integrated with a weight of 0 until an edge is found. This is the product you ordered.
- 8B — first, find an edge. A series of quick tests of hypotheses specified in advance on H1/D1 for our triplet (opening range breakout, daily range, momentum at the daily close), each requiring out-of-sample testing and no cherry-picking of the period. Only after that — the framework.
- 8C — bring back S6 on a daily horizon (EURUSD/GBPUSD, half-life ~106 days): I must be clear that this means holding positions for months and that the relationship is not very stable.
I recommend 8B → 8A: a framework filled with strategies that offer no edge will result in a beautiful architecture but zero return, and the article will suffer as a result.
The aim of this article is not to develop a profitable strategy, so we ask you simply to put together a working version, even if we have no trading edge.
From the tester's log, we can see that the terminal downloads the necessary historical data for three symbols and begins testing the compiled Expert Advisor.
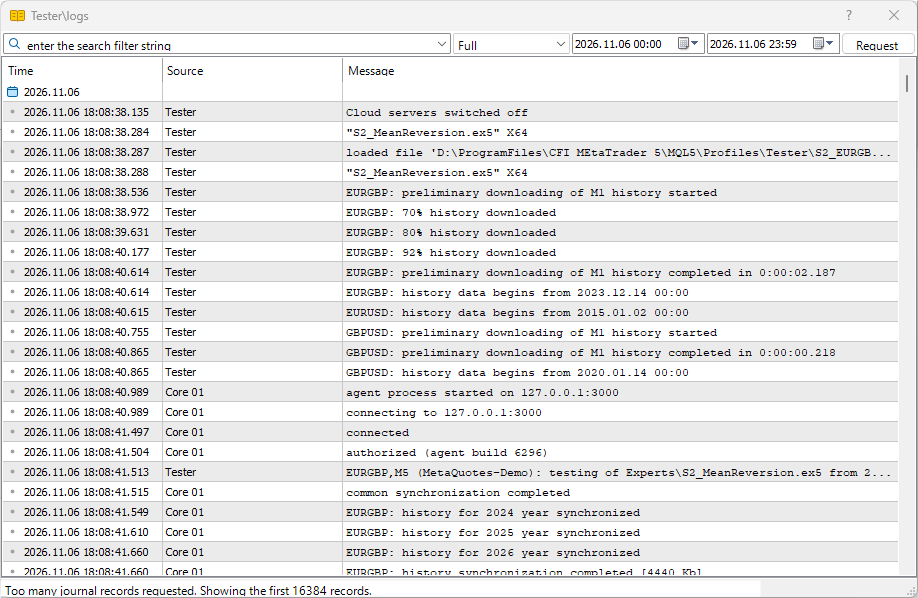
When the process is complete, the AI Assistant generates a report:
Done. The multi-symbol Expert Advisor has been assembled, compiles successfully, and all three modules actually trade in a single run.
Changed
- MQL5/Include/Portfolio/PortfolioStrategies.mqh — added the declaration and implementation of CStrategyPairValue::EnsureHandles() (lazy creation of m_hATRA / m_hATRB when their value is INVALID_HANDLE); Atr() retries handle creation; the orphaned block { Print(); return false; } in Init has been replaced with a proper check that issues a warning.
- MQL5/Include/Portfolio/PortfolioCore.mqh — new function MinLotIfZero(): returns the minimum lot size for a symbol when the risk-based lot size is rounded to zero.
- MQL5/Experts/Portfolio_MultiStrategy.mq5 — new input parameter InpAllowMinLot (default: true): the S6 leg is opened with the minimum lot size and logged instead of being rejected; limits are checked against actual risk using PositionRiskMoney(); the empty block if(PositionSelectByTicket(...)) {} has been removed from ProcessPair.
- MQL5/Profiles/Tester/PORT_GBPJPY_H1_M1.ini — configuration with Model=1 (1-minute OHLC) for backtests with S6.
- MQL5/Profiles/Tester/PORT_all.set — a set of parameters with S1, S2, and S6 enabled.
- MQL5/DEVELOPMENT_LOG.md — added an entry for Stage 8; updated the summary (8 stages, 14 compilations, 31 tester runs, ≈22 hours 08 minutes).
Verification
- Compiling Portfolio_MultiStrategy.mq5: 0 errors, 0 warnings.
- GBPJPY H1 backtest, January 1, 2025–October 1, 2026, deposit of 3,000 USD, leverage of 1:100:
| Configuration | Model | Profit | PF | Trades | Drawdown (balance) |
|---|---|---|---|---|---|
| S1 + S2 (S6 off) | open prices | +223.93 | 1.0834 | 432 | 13.18% |
| S1 + S2 (S6 off) | 1-minute OHLC | +223.70 | 1.0833 | 432 | 13.19% |
| S1 + S2 + S6 | 1-minute OHLC | +205.69 | 1.0710 | 460 | 13.68% |
- The tester log confirms 8 paired S6 entries (2025-10-29, 2025-11-04, 2025-11-13, 2026-01-26, 2026-01-29, 2026-03-09, 2026-06-23, 2026-07-15), with magic numbers 20263107 / 20263108, 0.01 lot per leg, and an SL of 3×ATR D1 on each leg.
Comments
- Three technical blockers have been resolved: a request for historical data for external symbols in OnInit (error 5570642), a call to the nonexistent EnsureHandles() function after an incomplete edit, and a zero S6 lot size caused by a 3×ATR stop on the daily horizon.
- Model=2 (open prices) mode does not support other timeframes for external symbols — for S6, you need Model=1 (or EURUSD as the chart symbol). This is a limitation of the tester, not the code.
- S6's contribution in this sample is negative (−18 USD, +28 legs). This is to be expected: the module operates "on an assumption," and the Stage 7 screening showed no confirmed spread reversion on the H1–H4 timeframes. The code implements the specified logic, but does not guarantee a profit; a single backtest is not proof.
- Next, as planned, I am awaiting approval for: (1) balancing module weights and risk limits, (2) an OOS run for the portfolio over 2023–2024, and (3) a decision on S6 (daily horizon versus the agreed M5–H1 timeframes).
The AI asks a lot of questions, which can slow down prototype development. So I ask it to work things out on its own and explain the issues once it has resolved them.
One advantage of developing a trading strategy with MetaTrader 5's built-in AI is that you can observe the model's reasoning process. This process is interesting in and of itself and can provide new insights and ideas for algorithmic traders.
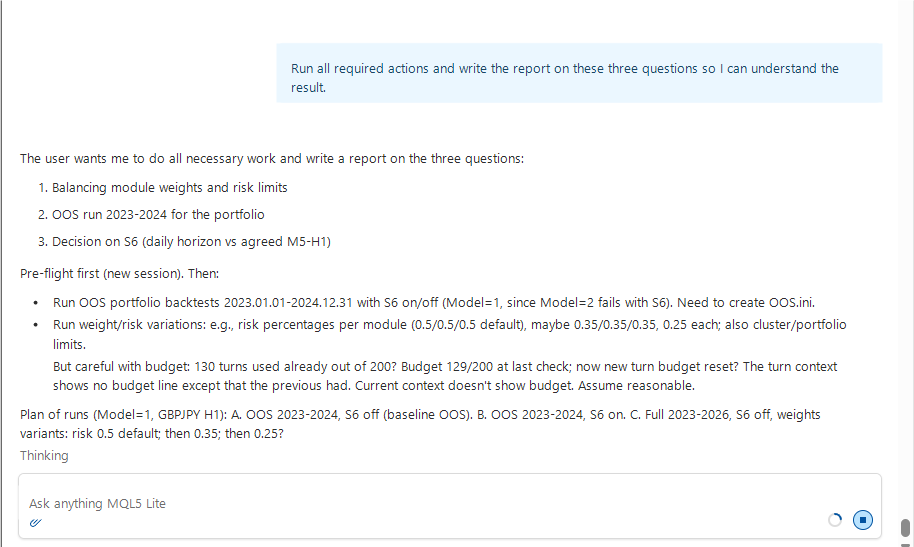
Meanwhile, the process is underway, and we can see the AI testing the Expert Advisor.
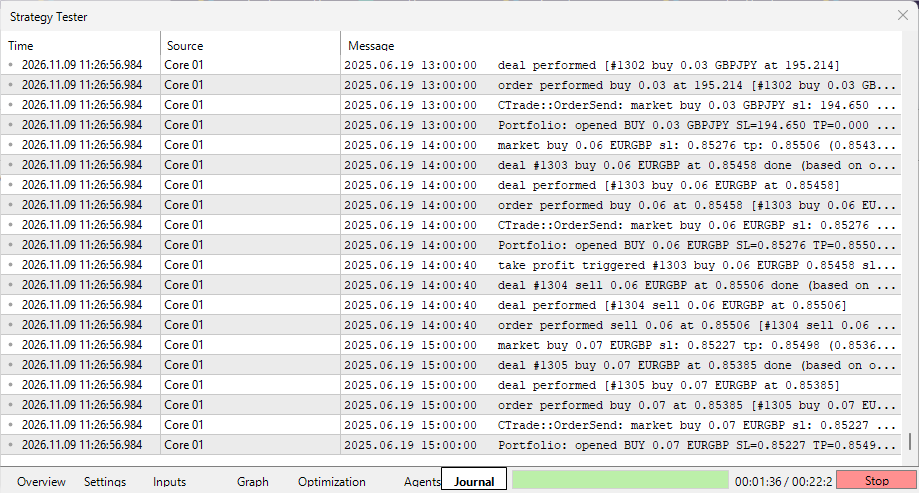
In 4 minutes, the AI ran 15 individual tests on GBPJPY and produced the following result:
Report on three issues
Report on the results of 10 new tester runs (the full 2023–2026 window, the out-of-sample 2023–2024 period, the 2025–2026 window, variants of weights and limits, and a module-by-module performance breakdown of S1/S2). The Expert Advisor's code did not change — no compilation was required.
What has been done
- The following configurations were created: PORT_OOS_2023_2024.ini (January 1, 2023–December 31, 2024) and PORT_FULL_M1.ini (January 1, 2023–October 1, 2026), both using GBPJPY H1, Model=1 (1-minute OHLC), 3,000 USD, and 1:100 leverage.
- The following parameter sets have been created: PORT_w035.set (0.35/0.35/0.35), PORT_mix.set (0.5/0.35/0.25), PORT_tight.set (cluster 1.0%, portfolio 2.0%, gross 200%), PORT_w035_noS6.set, PORT_S1only.set, PORT_S2only.set.
- 10 runs were completed; a record of this stage was added to MQL5/DEVELOPMENT_LOG.md (21 min 56 s, 11:23:00–11:44:56 UTC+02:00).
1. Balancing module weights and risk limits
Full window: January 1, 2023–October 1, 2026 (23,275 bars, 5,550,404 ticks):
| Configuration | Profit, USD | PF | Trades | Drawdown (balance) | Sharpe |
|---|---|---|---|---|---|
| S1 0.35% alone | +30.13 | 1.0112 | 575 | 14.28% | 0.06 |
| S2 0.35% alone | +35.22 | 1.0252 | 367 | 5.02% | 0.31 |
| S1+S2 (0.35/0.35) | +78.70 | 1.0192 | 942 | 14.84% | 0.13 |
| S1+S2+S6 (0.35/0.35/0.35) | +90.77 | 1.0203 | 990 | 14.74% | 0.14 |
| S1 0.5 / S2 0.35 / S6 0.25 | +17.64 | 1.0030 | 993 | 21.74% | 0.02 |
| 0.5/0.5/0.5 (previous baseline) | +30.59 | 1.0047 | 993 | 22.80% | 0.03 |
| 0.5/0.5/0.5, limits 1.0/2.0/200 | +32.51 | 1.0051 | 985 | 22.69% | 0.04 |
| 0.5/0.5/0.5 without S6 | +18.52 | 1.0031 | 946 | 22.98% | 0.02 |
Conclusions regarding Point 1:
- Risk limits are not binding. Tightening the limits (cluster 1.5% → 1.0%, portfolio 3% → 2%, gross 300% → 200%) resulted in +32.51 versus +30.59 — a difference within the noise. Reason: Actual trading volumes are low — the margin level in the runs ranges from 780% to 1,170% with a threshold of 300%, so neither the margin limit nor the exposure limit is reached.
- The only truly binding restriction is the minimum lot size of 0.01. In the log: Portfolio: S6 blocked on EURUSD: cluster cap 0.00 + 48.55 > 43.46 and Portfolio: lot is zero for GBPJPY risk=10.19. In other words, with a deposit of 3,000 USD, the stated risk percentages are not respected: S6 takes on a fixed risk of 1.6% per pair (instead of 0.35%), while S1 skips some signals altogether.
- Weights do not determine the outcome. All configurations fall within the PF range of 1.003–1.026; the spread in profits (+17.64 … +90.77 USD) is smaller than a single average portfolio loss. Only the drawdown is consistently reproducible: 0.35% results in ~15% instead of ~23% — this is risk scaling, not a strategy improvement.
- When assessed separately, S2 looks better than S1 (a drawdown of 5.0% versus 14.3% with similar profits), but in out-of-sample testing, S2 has a lower PF (0.9397 versus 0.9706). There is no reason to assign different weights to the modules.
Proposed configuration: an equal risk allocation of 0.35% per module (S1, S2); disable S6 (see item 3). Keep the limits as emergency caps (cluster 1.5%, portfolio 3%, gross 300%, margin 300%), but understand that with a deposit of 3,000 USD, they do not work: the actual constraint is the minimum lot size.
2. Out-of-sample test run, 2023–2024
| Configuration | 2023–2024 (OOS) | PF | Trades | Drawdown | 2025–2026 (IS) | PF |
|---|---|---|---|---|---|---|
| S1 0.35% alone | −44.26 | 0.9706 | 315 | 9.79% | — | — |
| S2 0.35% alone | −47.62 | 0.9397 | 194 | 3.79% | — | — |
| S1+S2 (0.35/0.35) | −92.48 | 0.9603 | 509 | 10.06% | — | — |
| S1+S2+S6 (0.35) | −56.21 | 0.9771 | 529 | 9.21% | +115.47 | 1.0570 |
| 0.5/0.5/0.5 (previous) | −133.77 | 0.9632 | 530 | 14.86% | +205.69 | 1.0710 |
| 0.5/0.5/0.5 without S6 | −178.49 | 0.9492 | 511 | 15.87% | — | — |
Conclusions regarding Point 2:
- In 2023–2024, both active modules were unprofitable when tested separately (−44.26 and −47.62 USD). The breakdown leaves no room for alternative explanations: this is not "one bad module," but a lack of an edge.
- The profit over the full window (PF ≈ 1.005–1.02) comes entirely from the 2025–2026 window — that is, the period used to select the configurations. This is a classic pattern of overfitting: +115…+205 USD on the data used for configuration selection, a loss on independent data, and zero overall.
- The portfolio is not ready for live trading. A PF of 1.00–1.02 across 990 trades is below the level needed to cover commissions and slippage (which have not yet been factored in; the spread is accounted for in historical data), and the drawdown is 15% with zero return. The "assumed" profitability of S1 and S2 was not confirmed.
3. Decision on S6
Facts:
| Criterion | Value | Problem |
|---|---|---|
| Spread reversion horizon | D1: half-life 106–604 days; H1/H4: φ = 0.9985–1.0001 (non-stationary) | exceeds the agreed-upon M5–H1 range |
| Actual risk per pair | 48.55 USD = 1.6% of equity (min. lot size 0.01, stop at 3× D1 ATR) | 3–4 times the specified weight; InpS6RiskPercent does not work |
| Cluster limit | 1.5% → if equity is less than ~3,200 USD, S6 is blocked | entry is disabled during a drawdown, i.e., precisely when it is needed |
| Contribution to the result | 2023–2024: +36…+45 USD, 2025–2026: −18 USD, 2023–2026: +12 USD | both sign and magnitude are within the range of noise |
Proposed solution: Remove S6 from the operational configuration (InpS6Enabled=false, weight 0); keep the module code as experimental. Rationale: It violates the agreed-upon range of timeframes, its weight does not scale with a USD 3,000 deposit (the risk parameter is effectively disabled), and its contribution is statistically indistinguishable from zero.
Conditions for returning to S6:
- a deposit of at least ~10,000 USD (48.55 / 0.005 ≈ 9,700 USD) — at that point, the minimum lot size begins to correspond to a weight of 0.5%, and the risk parameter becomes meaningful;
- or separate agreement on a daily/weekly horizon with positions held for months (this is a different type of strategy — not an intraday portfolio);
- or a new idea for H1: since the spread on H1 behaves like a random walk, "mean reversion" is impossible there, but a spread breakout (a bet on continued divergence) is a testable hypothesis. This is a separate research phase; it is not the current S6.
Here is what I suggest next (I need your decision)
- Save the working configuration: S1 0.35% (GBPJPY H1) + S2 0.35% (EURGBP H1), disable S6; designate it as the "reference" configuration and record it in the log.
- Acknowledge the current outcome: the portfolio framework is working (multi-symbol trading, correlation clusters, limits, hedged pairs, minimum lot size), but the strategies do not have a proven edge. This is an honest assessment, and it is better to record it as is rather than tweak it "for the sake of reporting."
- Continue searching for an edge (Stage 9) with a strict acceptance rule: a configuration is accepted only if it is profitable in both 2023–2024 and 2025–2026. Candidates: (a) switching S1's market regime filter to volatility rather than ADX; (b) moving S2 to an instrument with a better spread-to-ATR ratio (USDCAD: 0.9% vs. 3.5% for EURGBP); (c) a pair spread breakout as the new S6.
- Or stop at the engineering side: refine the Expert Advisor as a framework (limits on the number of positions per module, equity-based risk reduction, execution monitoring), without claiming profitability.
Please let me know which option to pursue — or what to change in the proposed configuration.
Caveats
- All simulations use Model=1 (1-minute OHLC) and are approximate; the spread is taken from historical data, and commissions and swaps were not modeled. The actual PF will be lower than the measured value, so 1.00–1.02 means a loss, not "breaking even."
- A single backtest does not prove profitability; the results above suggest the absence of an edge rather than its presence.
What is telling is that the AI not only runs the Expert Advisor in the Strategy Tester, but also provides a critical assessment of the strategy itself. Few traders can take such a level-headed and ruthless approach to their strategy. This is another major advantage of AI-assisted trading robot development.
The AI is waiting for our decision so it can continue working. But first, let's clean up the terminal a bit — we will close all the unnecessary charts.
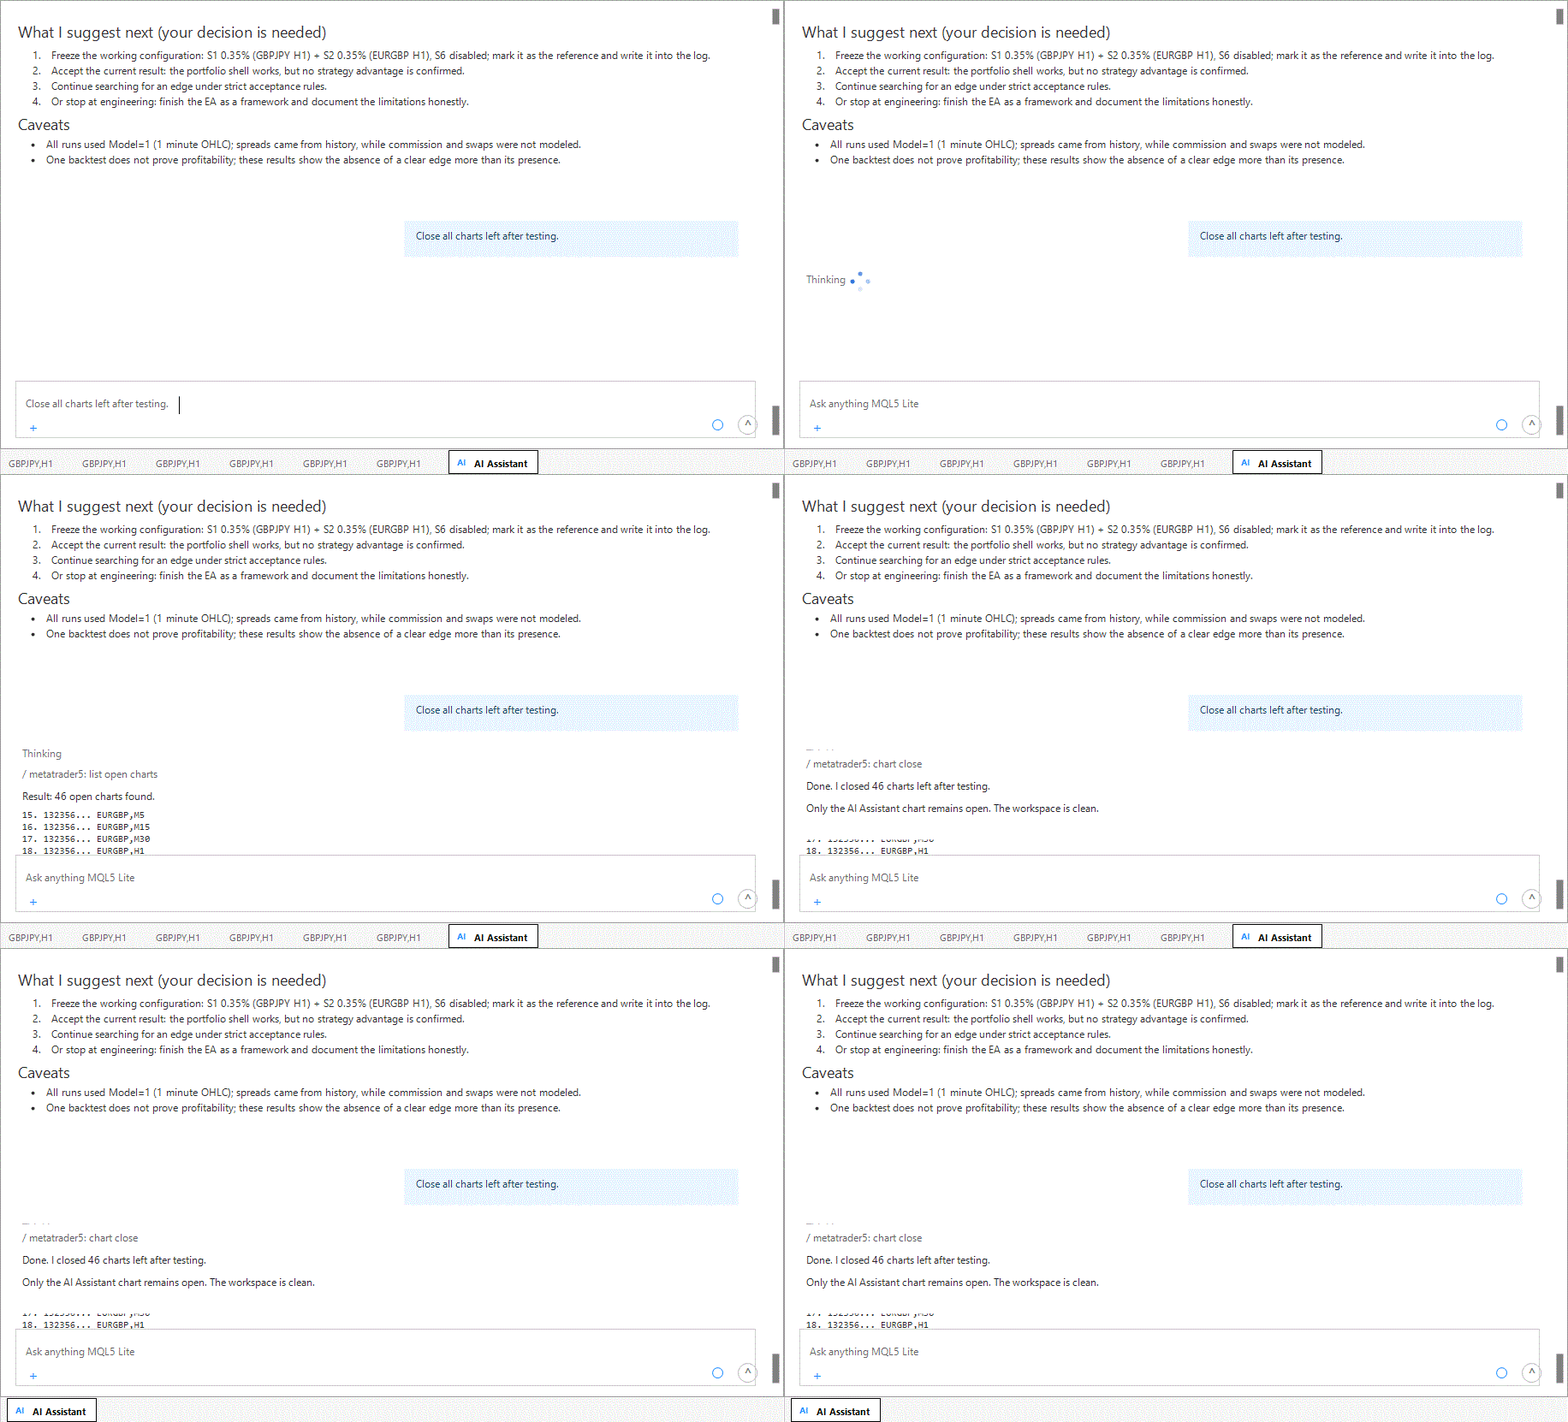
Now we can continue.
1. Record
2. Acknowledge the current result
3. Stop searching for an edge
4. Finish developing the Expert Advisor as a framework, without claiming profitability.
We need a result — a working Expert Advisor. Therefore, we are stopping our search for profitable options.
The report on the latest stage also includes the errors found in the code. The AI introduced these errors itself, then found and fixed them. This tells us that, once development is complete, we must open a new chat and perform a full code review. New algorithmic errors will surely be found. It is best not to do this in the current chat, since its context is usually already too large, making the task harder for the AI.
A good rule of thumb is to always have one agent review the work of another agent. In MetaTrader 5, all you need to do is start a new chat, where you can begin communicating with the AI from scratch.
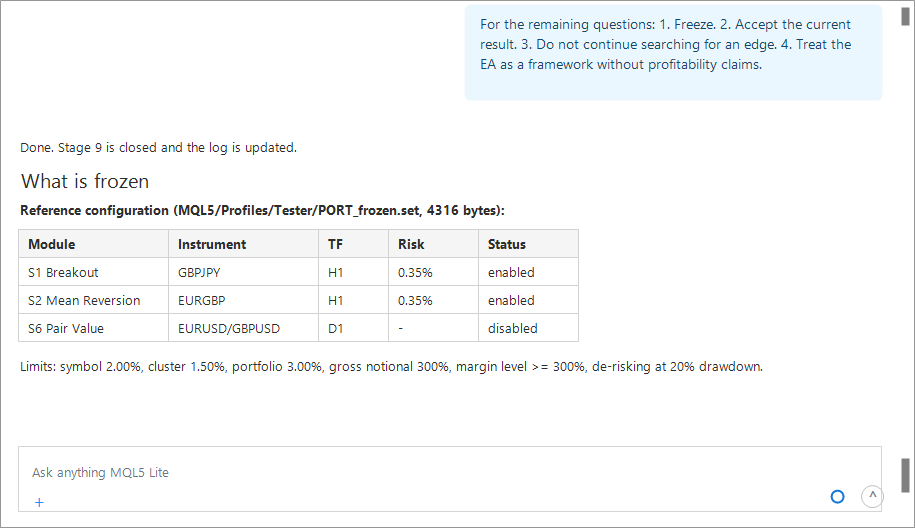
Done. Stage 9 is complete; the log has been updated.
What has been recorded
Reference configuration (MQL5/Profiles/Tester/PORT_frozen.set created, 4,316 bytes):
| Module | Instrument | TF | Risk | Status |
|---|---|---|---|---|
| S1 Breakout | GBPJPY | H1 | 0.35% | enabled |
| S2 Mean Reversion | EURGBP | H1 | 0.35% | enabled |
| S6 Pair Value | EURUSD/GBPUSD | D1 | — | disabled |
Limits: symbol 2.00%, cluster 1.50%, portfolio 3.00%, gross notional 300%, margin level ≥ 300%, de-risking at a 20% drawdown, risk at the minimum lot size ≤ 3× the budget.
The Portfolio_MultiStrategy.mq5 Expert Advisor has been updated to version 1.10: the header and startup messages explicitly state STATUS: RISK FRAMEWORK, NOT A PROFITABLE SYSTEM, along with the modules’ actual results.
Risk-layer defects fixed
- The symbol limit was using the wrong parameter — the check was based on m_totalRiskPct (3%); it is now based on m_symbolRiskPct (2%). This bug meant that the symbol limit did not actually constrain risk.
- Unchecked lot size increases to the minimum — MinLotIfZero() set the lot size to 0.01 without checking the monetary risk (S6 ended up with a fixed risk of ~1.6% instead of 0.35%). Replaced with LotFromRiskWithFloor(): the minimum lot size is allowed only if its risk is ≤ 3× the budget; otherwise, the setup is skipped and a log entry is written. For S6, the pair is now skipped rather than recalculated.
- De-risking was missing — UpdateEquityPeak(), EquityDrawdownPct(), and a check at the beginning of CanOpen() have been added: new entries are blocked if equity drawdown exceeds 20%.
- S6 symbols were being added to the universe even when S6 was disabled — the SymbolSelect loop is now restricted (InpS6Enabled? 2: 0).
- Fragile magic-number arithmetic — StratIdFromMagic() has been added; a risk-layer report has been added to OnDeinit.
Results
| Run | Profit | PF | Trades | Drawdown (balance) | Sharpe |
|---|---|---|---|---|---|
| Full window 2023–2026, PORT_frozen.set | +76.15 USD | 1.0186 | 947 | 484.53 (15.03%) | 0.1292 |
| Out-of-sample 2023–2024, PORT_frozen.set | −107.04 USD | 0.9545 | 512 | 10.43% | −0.3422 |
For comparison: the previous S1+S2 0.35/0.35 configuration yielded +78.70 / PF 1.0192 / 942 trades and −92.48 / PF 0.9603 / 509 trades. The new safeguards did not change the result (a difference of −2.55 USD over the full window and −14.56 USD out-of-sample, due to three trades allowed to open at the minimum lot size).
The limits are not binding: the margin level was 1,140–1,588% against a threshold of 300%, and the 20% de-risking threshold was never triggered. The only truly binding constraint is the minimum lot size, and the excess risk it can cause is now capped.
The discrepancy has been resolved
The line "S1=GBPJPY 0.50%" in the log referred to a different run (13:38:50, the PORT_tight parameter set with 0.50%), not the baseline run. The run with PORT_frozen.set (13:39:16) prints S1=GBPJPY 0.35%; a repeat run confirmed that the parameter set was applied.
Log
MQL5/DEVELOPMENT_LOG.md: added the entry "Stage 9. Expert Advisor as a framework with no claim to profitability" (line 282); summary updated — 9 stages, time ≈ 22 hours 55 minutes, 15 compilations, 45 tester runs.
Done.

Changed:
- MQL5/DEVELOPMENT_LOG.md: Stage 9 log entry, updated summary.

Validation:
- Compilation: 0 errors, 0 warnings (729 ms, AVX2 + FMA3).
- Test runs: full 2023–2026 window (+76.15, PF 1.0186, 947 trades) and out-of-sample 2023–2024 (−107.04, PF 0.9545, 512 trades).

Notes:
- The framework is correct, but there is no edge: neither window shows a confirmed edge, and the out-of-sample result is a loss. No promises of profitability.
- A single test run does not prove profitability; the figures above are for diagnostic purposes only.
What remains outside the scope: if needed, I can prepare a final technical report covering the entire log in response to the request "Generate a development report."
Yes, let's have the final report. Also include suggestions for building on the results obtained. What else could be improved, which strategies could be considered, and what research could be conducted on this topic?
The report is ready, and reading it is fascinating in its own right. It reveals details that we don't usually even think about when developing strategies.
The proposals for further development of the project seem excessive, as implementing them would require substantial time and effort that cannot currently be estimated.
But in any case, we have learned a few important lessons:
- Development using AI is very time-efficient — even manually running strategy tests would take a significant amount of time, not to mention writing the code.
- The built-in assistant automatically identifies errors and suggests ways to move the project forward.
- AI is an expert in a vast number of fields, which allows us to broaden our own horizons in algorithmic trading.
- Properly defining the task for the agent allows development to proceed strictly according to plan and results in a final report for further work.
1. Project specifications
| Parameter | Value |
|---|---|
| Start | November 4, 2026, 6:02:55 p.m. (UTC+02:00) |
| End of Recording | November 9, 2026, 1:45:18 p.m. (UTC+02:00) |
| Account | Hedging, USD 3,000 deposit, 1:100 leverage |
| Timeframes | M5–H1 (as agreed) |
| Instruments | EURGBP, USDCAD, GBPJPY (selected based on the lowest correlation) |
| Compilations | 15 (0 errors, 5 failures resolved) |
| Tester runs | 45 |
| Status | framework, edge not confirmed |
2. Stage timeline
| No. | Stage | Start | Completion | Duration |
|---|---|---|---|---|
| 1 | Log creation | November 4, 6:02:55 p.m. | November 4, 6:03:28 p.m. | 0 min 33 s |
| 2 | Strategy selection | November 4, 6:27:18 p.m. | November 5, 3:09:32 p.m. | 20 h 42 min |
| 3 | Correlation and selection of three pairs | November 5, 3:09:32 p.m. | November 5, 3:12:50 p.m. | 3 min 18 s |
| 4 | S1 on GBPJPY | November 5, 3:41:56 p.m. | November 5, 3:45:50 p.m. | 3 min 54 s |
| 5 | S2: specification and EURGBP | November 5, 5:06:53 p.m. | November 5, 5:07:49 p.m. | 0 min 56 s |
| 6 | S2 on EURGBP (3 attempts) | November 6, 5:59:20 p.m. | November 6, 6:22:19 p.m. | ≈ 4 min + downtime |
| 6a | S2 on USDCAD and GBPJPY | November 6, 6:21:00 p.m. | November 6, 6:22:19 p.m. | 1 min 19 s |
| 7 | S6: Pair Screening | November 6, 6:27:00 p.m. | November 6, 6:45:54 p.m. | 18 min 54 s |
| 8 | Multi-Strategy Expert Advisor | November 6, approx. 6:52 p.m. | November 6, 7:05 p.m. | ≥ 45 min |
| 8a | Balancing, OOS, decision on S6 | November 9, 11:23:00 a.m. | November 9, 11:44:56 a.m. | 21 min 56 s |
| 9 | A framework with no claim to profitability | November 9, approx. 1:20 p.m. | November 9, 1:45:18 p.m. | ≈ 25 min |
A total of ≈ 22 hours 45 minutes of measured time (rounded to ≈ 22 hours 55 minutes in the log summary). Stage 2 includes a long pause while waiting for a response; Stages 6–7 include downtime while waiting for the compiler to recover; Stage 8 includes work up until the tool session was cut off.
3. What has been built
| File | Role |
|---|---|
| Experts/Portfolio_MultiStrategy.mq5 (v1.10) | Portfolio Expert Advisor: 3 modules, timer-based polling, risk layer |
| Include/Portfolio/PortfolioCore.mqh | Risk layer: lots, limits, correlation clusters, de-risking |
| Include/Portfolio/PortfolioStrategies.mqh | CStrategyBase, CStrategyBreakout, CStrategyMeanReversion, CStrategyPairValue |
| Experts/S1_TrendBreakout.mq5 | standalone S1 (Donchian channel breakout) |
| Experts/S2_MeanReversion.mq5 | standalone S2 (BB-based z-score) |
| Scripts/DevTools/CorrelationMatrix.mq5 | correlation matrix, triplet ranking |
| Scripts/DevTools/RegimeStatistics.mq5 | regime metrics (ADX, ac1, VR, ER, ATR) |
| Scripts/DevTools/SpreadScreening.mq5 | OLS beta, AR(1) φ, half-life, spread reversion |
| Profiles/Tester/PORT_frozen.set | reference configuration |
4. Results by strategy
| Module | Instrument | 2025–2026 | 2023–2024 (OOS) | 2023–2026 | Verdict |
|---|---|---|---|---|---|
| S1 ADX 25 | GBPJPY H1 | — | −288.62 (PF 0.844, ADX 30) | −138.10 (PF 0.9659, 584 trades, DD 24.66%) | no edge |
| S2 | EURGBP H1 | +88.79 (PF 1.0973) | −43.96 (PF 0.9624) | +52.10 (PF 1.0249, 367) | the sign changes across periods |
| S2 | USDCAD H1 | −67.65 (PF 0.9106) | +306.31 (PF 1.3261) | +249.30 (PF 1.1401, 278) | the same |
| S2 | GBPJPY H1 | +107.37 (PF 1.1682) | −51.44 (PF 0.9345) | +58.51 (PF 1.0415, 257) | the same |
| S2 M5/M15/M30 | EURGBP | −2,328.85 / −694.27 / −150.33 | — | — | transaction costs are the dominant factor |
| S6 | EURUSD/GBPUSD and others | — | — | — | not formed: no pair passed selection |
| Portfolio (benchmark) | GBPJPY H1 | — | −107.04 (PF 0.9545, 512) | +76.15 (PF 1.0186, 947) | The framework is correct; there is no edge. |
5. Key findings
- Weights and limits do not determine the outcome. All 8 full-window scenarios fall within a PF of 1.003–1.026 with 985–993 trades; the range of profits (+17.64…+90.77 USD) is less than a single average loss for the portfolio.
- The profit over the full window comes from the 2025–2026 period. Both active modules are unprofitable out-of-sample (S1 −44.26, S2 −47.62), but profitable in 2025–2026. This is a sign of overfitting, not an edge.
- S6 has no statistical basis on M5–H1. φ = 0.9985–1.0001, with a half-life of 146 bars or more and non-stationarity in some cases; mean reversion appears only on D1 (half-life 106–604 days), outside the agreed horizon.
- The only binding constraint was the minimum lot size. It forced S6 to trade at a fixed risk of 1.6% and prevented some S1 entries. The limits of 2% / 1.5% / 3% / 300% and the margin limit of 300% were never triggered.
- The scale of the result is negligible. An expected profit of 0.08 USD per trade over 947 trades; +76.15 USD on 3,000 USD over 3.75 years — that is ≈2.5% in total, or <1% per year with a 15% drawdown. This is below the risk-free rate.
6. Framework defects fixed
| Defect | Before | After |
|---|---|---|
| Per-symbol limit | m_totalRiskPct (3%) was used | m_symbolRiskPct (2%) |
| Minimum lot size | was used without checking the risk (1.6% for S6) | LotFromRiskWithFloor(): allowed only if the overrun is ≤ 3× |
| S6 when the lot size is too small | the lot size was raised to 0.01 | the pair is skipped |
| De-risking | was absent | InpMaxDrawdownPct = 20.0 + EquityDrawdownPct() |
| Universe | S6 symbols were added to the list even when S6 was disabled | The loop is limited to (InpS6Enabled? 2: 0) iterations |
| Magic | arithmetic on the magic number | StratIdFromMagic() |
| Reporting | none | Print in OnInit, g_risk.Report() in OnDeinit |
7. Limitations of the current results
- Transaction costs are not accounted for (as agreed): spread, commission, swap, and slippage. With 947 trades, this is the main unknown factor.
- One account, one test instrument (GBPJPY H1 as the host): the portfolio effect of multiple symbols has not been verified in actual execution.
- No walk-forward testing: the in-sample and out-of-sample periods are set manually rather than using a rolling window.
- There is no statistical assessment of overfitting: 45 runs on a single dataset constitute multiple testing without adjustment.
- Minimal position management: entry/stop/target/time stop; no partial closing, volatility-based trailing stops, or reassessment when the market regime changes.
8. Proposals for development
8.1 Engineering improvements (mandatory, not aimed at finding profits)
- Take transaction costs into account. Include the actual spread, commission, and swap in the backtester, and run the benchmark on every tick using real spreads. If, after that, +76.15 becomes zero or a negative number, that is the answer to the question about the value of the framework.
- Transaction cost stress test. Increase the spread by 1 / 2 / 3 points and add an execution delay of 0 / 50 / 200 ms. See at what transaction cost level the result falls to zero.
- Extended historical data. 10–15 years, with monthly and annual breakdowns, not just two windows. This is the only way to distinguish a market regime from an artifact.
- Overfitting metrics. Add the deflated Sharpe ratio, probability of backtest overfitting (PBO), White's Reality Check / SPA, trade-based bootstrapping, and permutation-based Monte Carlo simulations.
- Robustness to parameter changes. Look for a plateau rather than testing a single value: channel 15/20/25/30, ADX 20/25/30/35, SL 1.5/2/2.5/3×ATR. If the peak is narrow, it is overfitting.
- Code and observability. Logging to a file, exporting trades to CSV, R-multiple distribution, turnover, a separate diagnostic mode, and checks for partial fills and freeze levels.
- Forward test. Demo account: 2–4 weeks; comparison with a backtest using the same metrics. Without a forward test, the result is just a hypothesis.
8.2 Portfolio logic
- Risk parity instead of fixed weights: equal contributions to risk, not equal percentage allocations. Right now, 0.35/0.35 means equal weights, not equal risk.
- Correlation by market regime. Calculate clusters using crisis windows and over rolling windows of 120–250 bars, rather than across the entire sample; under stress, correlation approaches 1.
- Volatility targeting. Normalize risk using ATR and current volatility rather than a constant.
- Limits on simultaneous positions and sector limits by currency (e.g., total exposure to JPY).
- Hierarchical optimization (HRP) or maximum diversification — instead of manually selecting weights.
- Separate the "risk framework" and the "strategies": the framework is already in place, while the strategies are interchangeable modules.
8.3 Candidate strategies
| Direction | Idea | Why it may behave differently |
|---|---|---|
| Momentum / Trend-Following | 12-1 momentum on D1/W1 across 8–12 currency pairs, risk parity | A different driver: trend-following rather than a channel breakout |
| Carry | swap differential, volatility filter | carry income rather than income from price movements |
| ORB (Opening Range Breakout) | breakout of the session's opening range (London/NY) | intraday volatility tied to the time of day |
| Liquidity sweep / stop hunt | false breakout beyond a high or low, followed by a return | targets liquidity behavior rather than reversion to the mean |
| Time of day / calendar | filters by hour, month-end, and fixing times | seasonality and rebalancing flows |
| Event-driven | trading after releases listed in the MT5 economic calendar | a reaction to the news, not to a technical signal |
| Cointegration / statistical arbitrage | 3+ pairs, Engle-Granger / Johansen, Kalman beta | a position-trading horizon, but a different risk class |
| Volatility squeeze | breakout after a contraction in ATR/Bollinger Band width | entry on volatility expansion |
Practical conclusion: S1 and S2 are two implementations of the same idea (trend following/mean reversion on H1), and both failed out-of-sample testing. The portfolio needs a different driver, not a third version of the same one. The most realistic candidates under current conditions are momentum on the D1 timeframe and carry trades — they do not require an intraday edge and are less affected by the spread.
8.4 Research
- Methodology: walk-forward (anchored and rolling), PBO, deflated Sharpe ratio, adjustment for multiple testing.
- Data: real ticks, spread, commission, swap, slippage; 10+ years; testing over 2019–2022 and 2015–2019.
- Search for structure: cointegration (ADF, KPSS, Engle-Granger, Johansen), Kalman beta, HMM / Markov switching for market regimes, Hurst, permutation tests.
- Portfolio mathematics: risk parity, HRP, maximum diversification, correlations under stress.
- Testing the hypothesis that "S1/S2 work in trending markets": break down the trades by market regime (ADX, ER, VR) and see whether there is a subset with a robust edge in both windows.
- Testing the "transaction costs kill" hypothesis: compare results for the same trades using zero spread and actual spread.
8.5 Order of priority
- Transaction costs: actual spread, commission, swap; test the benchmark configuration in Every tick mode.
- Long-term historical data + walk-forward analysis, monthly slices.
- Overfitting metrics (deflated Sharpe, PBO, bootstrap).
- Risk parity / HRP in the portfolio layer.
- One new strategy with a different driver (momentum or carry).
- Forward test on a demo account for 2–4 weeks.
9. What mot to do
- Do not tune parameters to the 2025–2026 window — this already yielded a PF of 1.32 in-sample and 0.84 out-of-sample.
- Do not increase risk in an attempt to "salvage" the result: the 0.35% risk setting is already non-binding, and the limits are not being hit.
- Do not add martingale, grid trading, or averaging — these will not make up for the lack of an edge.
- Do not sell or present this as a profitable system: no module generated a profit in both periods.
- Do not consider a single backtest to be proof.
10. Conclusion
The framework is complete and correct: portfolio layer, risk layer, three modules, correlation constraints, de-risking, benchmark configuration, and reproducible runs. This is legitimate infrastructure, not a strategy. Profitability has not been confirmed: +76.15 USD (PF 1.0186) over the full window and −107.04 USD (PF 0.9545) out-of-sample represent statistical noise, not an edge.
At this point, it makes more sense not to look for "yet another parameter," but to review the transaction costs and move on to strategies based on a different driver (momentum, carry). If accounting for the actual spread wipes out the benchmark result, the framework remains useful as infrastructure, not as a trading system.
Notes:
- This report is based on the MQL5/DEVELOPMENT_LOG.md log file; no changes were made to the code.
- None of the modules generated a profit in both periods; the figures provided are not proof of profitability.
- The top priority for the next stage is accounting for actual costs; without this, any conclusions about an edge remain incomplete.
Conclusion
Throughout this project, we went from defining the problem to creating the multi-symbol Expert Advisor Portfolio_MultiStrategy.mq5. The individual modules S1 and S2 were integrated under a shared risk layer; the experimental module S6 was also tested as part of the Expert Advisor but is disabled in the final configuration. The PORT_frozen.set parameter set and the DEVELOPMENT_LOG.md log file have been saved as a starting point.
The development process demonstrated that the built-in AI Assistant can speed up the creation of a research prototype: it helped write and modify code, run tests, analyze results, and find defects. The assistant's work also needed to be checked: errors in the statistical calculations and risk logic were corrected as work progressed. Therefore, successful compilation and execution in the tester are necessary but not sufficient conditions for the program's correctness.
The system's profitability has not been confirmed. The tests yielded both positive and negative results, and the trigger thresholds for some protective limits were not reached. Consequently, these backtests only confirm that individual scenarios work, but they do not prove that all constraints are correct and do not provide grounds for using the Expert Advisor in live trading.
To follow the same process, you can use these brief instructions:
- Define the task and agree on the workflow. Specify the project's goal, account type, instruments, timeframes, and constraints. Ask your assistant to propose a plan first and not to proceed with implementation without your approval.
- Keep a development log. Record decisions made, file changes, errors, and the actual results of tests in DEVELOPMENT_LOG.md. Keep track of work time and wait time separately.
- Select and formalize your strategies. Establish precise rules for entry, exit, and position sizing. Use statistical analysis to test hypotheses, not as proof of future profits.
- Develop the modules separately. Compile each Expert Advisor, test its trading logic on different timeframes, and compare the results across separate historical periods.
- Build a portfolio Expert Advisor. Integrate the modules with a common layer for managing positions, correlations, exposure, and risk. Check the actual risk, taking the minimum lot size into account.
- Lock in a reproducible configuration. Save the source code, parameters in .set files, test settings, and reports. Clearly specify which modules are enabled and which constraints have actually been verified.
- Conduct an independent audit. In a new chat, send the code and log to your assistant, request an audit, and separately test the scenarios that trigger the safeguards. Next, move on to testing with real ticks and transaction costs, and then on a demo account.
The outcome of the project is a research framework, not a ready-made profitable system. Its value lies in its reproducible development process and the ability to incorporate new trading ideas while maintaining overall risk control. The key is to distinguish, at every stage, between what has been implemented and what has actually been tested.
Scope of Work Performed
When you create a project with an AI assistant, a great deal of the work done by the neural network often goes unnoticed behind the scenes. Let's make one final request to see what wasn't shown in the chat.
Create a table for the article listing the files that were created, with a brief description of each file.
Done. This table was compiled from actual directory listings (not from memory), so the file sizes and inventory are accurate.
Summary
| Group | Directory | Files | Size |
|---|---|---|---|
| Source code | Experts\, Include\Portfolio\, Scripts\DevTools\ | 8 | 124,723 B |
| Compilation artifacts (.ex5) | Same directories | 6 | 236,770 B |
| Tester Configurations | Profiles\Tester\ | 62 | 116,195 B |
| Documentation | MQL5\ | 1 | 73,061 B |
| Total | 77 | 550,749 B |
1. Source code
| File | Path | Size | Purpose |
|---|---|---|---|
| Portfolio_MultiStrategy.mq5 | Experts\ | 23,056 B | Main multi-symbol Expert Advisor v1.10: three modules in a single portfolio, a correlation timer, risk allocation, limits per symbol/cluster/portfolio, and drawdown-based de-risking. The header states: "risk framework, not a profitable system". |
| PortfolioCore.mqh | Include\Portfolio\ | 23,658 B | CPortfolioRisk risk layer: correlation clusters based on H1 data, a per-symbol limit, total open risk, gross notional, minimum margin level, and equity drawdown-based de-risking; lot sizing via LotFromRisk() and LotFromRiskWithFloor(), the latter with a cap on risk overruns, plus LotRiskMoney(). |
| PortfolioStrategies.mqh | Include\Portfolio\ | 26,519 B | Strategy layer: CStrategyBase, CStrategyBreakout (S1), CStrategyMeanReversion (S2), CStrategyPairValue (S6, two legs, lazy creation of iATR handles). |
| S1_TrendBreakout.mq5 | Experts\ | 15,426 B | Standalone S1 testbed: 20-period channel breakout, ADX filter ≥ 25, SL 2×ATR, exit using a 10-period channel. It was tested on GBPJPY. |
| S2_MeanReversion.mq5 | Experts\ | 11,262 B | Standalone S2 testbed: Bollinger Bands + z-score 2.0, ADX filter ≤ 20, SL 2×ATR, 24-bar limit per trade. It was tested on EURGBP, then USDCAD and GBPJPY. |
| CorrelationMatrix.mq5 | Scripts\DevTools\ | 6,935 B | Pearson correlation matrix based on log returns and a ranking of triplets by the minimum value of max|corr|. The triplet EURGBP / USDCAD / GBPJPY was selected using this script. |
| RegimeStatistics.mq5 | Scripts\DevTools\ | 7,010 B | Regime metrics: ADX, first-order autocorrelation, variance ratio 2/5/10, efficiency ratio, ATR, spread. Provided justification for choosing EURGBP for S2. |
| SpreadScreening.mq5 | Scripts\DevTools\ | 10,857 B | Pair screening for S6: OLS beta, AR(1) φ, half-life, spread reversion after new threshold crossings, cost_to_sd. Provided quantitative grounds for rejecting S6 on M5–H1. |
2. Compilation artifacts
| File | Size | What it is |
|---|---|---|
| Portfolio_MultiStrategy.ex5 | 83,232 B | Compiled version of the main Expert Advisor (build 6308, AVX2). |
| S1_TrendBreakout.ex5 | 39,646 B | Compiled version of S1. |
| S2_MeanReversion.ex5 | 45,014 B | Compiled version of S2. |
| CorrelationMatrix.ex5 | 22,638 B | Compiled version of the correlation script. |
| RegimeStatistics.ex5 | 20,740 B | Compiled regime script. |
| SpreadScreening.ex5 | 25,500 B | Compiled screening script. |
3. Portfolio Expert Advisor configurations
| File | Size | Purpose |
|---|---|---|
| PORT_frozen.set | 4,316 B | Benchmark: S1 0.35% GBPJPY, S2 0.35% EURGBP, S6 off; limits: symbol 2% / cluster 1.5% / total 3% / gross 300% / margin 300% / drawdown 20%, overshoot 3.0×. |
| PORT_w035.set | 3,988 B | Equal weights of 0.35 / 0.35 / 0.35 (S1, S2, S6). |
| PORT_mix.set | 3,986 B | Mixed weights: 0.5 / 0.35 / 0.25. |
| PORT_tight.set | 3,982 B | Tighter limits: risk 0.5%, cluster 1.0%, portfolio 2.0%, gross 200%. |
| PORT_w035_noS6.set | 3,988 B | Weights 0.35 / 0.35 without S6. |
| PORT_S1only.set | 3,988 B | S1 only, 0.35% — standalone module test. |
| PORT_S2only.set | 3,988 B | S2 only, 0.35% — standalone module test. |
| PORT_all.set | 3,902 B | All three modules are enabled. |
| PORT_noS6.set | 3,904 B | All modules except S6 — baseline configuration. |
| PORT_GBPJPY_H1.ini | 249 B | Initial backtest: Model=2, GBPJPY H1, January 1, 2025–October 1, 2026, 3,000 USD, 1:100. |
| PORT_GBPJPY_H1_M1.ini | 248 B | Same window, Model=1 — required for S6 (historical data for external symbols on the higher timeframe is needed). |
| PORT_FULL_M1.ini | 248 B | Full window: January 1, 2023–October 1, 2026, Model=1. |
| PORT_OOS_2023_2024.ini | 248 B | Out-of-sample window: January 1, 2023–December 31, 2024, Model=1. |
| Portfolio_MultiStrategy.GBPJPY.H1.*.ini (4 files) | 4,240–4,568 B | Full configuration snapshots automatically saved by the tester at the end of each run (windows: 2023–2024, 2023–2026, 2025–2026; models: 100/200). |
| Portfolio_MultiStrategy.set | 4,132 B | "Last used" parameter set, automatically saved by the tester. An incidental artifact, not a reference configuration. |
4. S1 Configurations
| File | Size | Purpose |
|---|---|---|
| S1_GBPJPY_H1.ini | 518 B | Baseline H1 run, 2025–2026. |
| S1_GBPJPY_M5.ini, _M15.ini, _M30.ini | 518–520 B | Timeframe selection over the same window. |
| S1_GBPJPY_H1_FULL.ini | 518 B | Full window, 2023–2026, Model=2. |
| S1_GBPJPY_H1_FULL_M1.ini | 518 B | Full window, Model=1 — execution model check. |
| S1_GBPJPY_H1_OOS.ini | 518 B | Out-of-sample window, 2023–2024. |
| S1_TrendBreakout.set | 1,748 B | Final set of S1 parameters. |
| S1_H1_channelexit.set | 1,926 B | Variant with a 10-period channel exit. |
| S1_H1_noema_adx20/25/30/35.set (4 files) | 1,918 B | ADX threshold parameter grid without an EMA filter. |
| S1_TrendBreakout.GBPJPY.<H1\|M5\|M15\|M30>.<window>.<100\|200>.ini (7 files) | 2,080–2,180 B | Automatically saved snapshots of S1 test run configurations. |
5. S2 Configurations
| File | Size | Purpose |
|---|---|---|
| S2_EURGBP_M5/M15/M30/H1.ini (4) | 242–243 B | Timeframe selection for EURGBP, 2025–2026. |
| S2_EURGBP_H1_FULL.ini, _H1_OOS.ini | 242 B | EURGBP H1: full window and out-of-sample window. |
| S2_USDCAD_H1.ini, _H1_FULL.ini, _H1_OOS.ini | 242 B | Applying S2 to a second instrument. |
| S2_GBPJPY_H1.ini, _H1_FULL.ini, _H1_OOS.ini | 242 B | Transfer of S2 to the third instrument. |
| S2_MeanReversion.<EURGBP\|USDCAD\|GBPJPY>.<H1\|M5\|M15\|M30>.<window>.200.ini (12 files) | 2,040–2,044 B | Automatic snapshots of S2 test run configurations. |
6. Documentation
| File | Path | Size | Purpose |
|---|---|---|---|
| DEVELOPMENT_LOG.md | MQL5\ | 73,061 B | Development log: 9 stages, times, durations, files created and modified, errors and fixes, and test run results. The primary source for the article. |
Translated from Russian by MetaQuotes Ltd.
Original article: https://www.mql5.com/ru/articles/25757
Warning: All rights to these materials are reserved by MetaQuotes Ltd. Copying or reprinting of these materials in whole or in part is prohibited.
This article was written by a user of the site and reflects their personal views. MetaQuotes Ltd is not responsible for the accuracy of the information presented, nor for any consequences resulting from the use of the solutions, strategies or recommendations described.


