
Tester in the Terminal MetaTrader 4: It Should Be Known

Introduction
Working in financial markets is impossible without a trading system. Traders spend a lot of time and effort developing rules of opening and closing positions, empirically select methods of modifying these positions by Trailing Stop. Here knowledge from different fields of science is used. And when the strategy is created, the first thing to do is to test the mechanical trading system (MTS) on historical data. It means that the tester becomes the most important component of any program.
Two Types of Modelling:
Not all programs for technical analysis (TA) have the option of testing, so much not every terminal! Even if a program is stated to have a tester and has the option of testing, it may have errors or architectural restrictions and prohibitions. That is why during the tester development for the terminal MetaTrader 4 it was very important to include in advance the architectural solutions, which would hinder the existence of a whole class of strategies, based on the knowledge of future. There are two ways of program testing of any strategy:
- Based on the already composed bars, prepare in advance a data file, which would contain all required values of prices, indicators and other parameters, and then send this file to the tester (it generates the necessary sequence with theoretical possibility to dip into the future). The information is received in the form of already composed bars without modelling the formation of price bars;
- prepare a file containing only modelled price, and send into the tester entry the price changes (price ticks), like in real life. Here the tester has no future inherently.
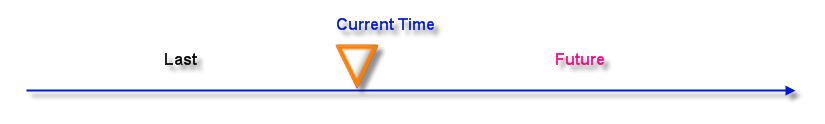
The triangle "Current Time" denotes a place, where the tester is located at the present point of time. In the first case we see the past time (Last), where the tester has processed data, and the future time (Future), where the tester will operate. Both, past and future, are already calculated (indicators, close price, open price, High and and Low), the tester just follows this sequence. And if there is a possibility of seeing future (real or error), the results of testing need a thorough verification. And closing already known possibilities does not ensure that there are no other possibilities. This is eventually a constant problem for a tester developer or tester users.
In the second case we have only the past time (Last), there is no future inherently (a dark square). In this approach we always have the information only about the past, and no information about the future, like in real trading. With each new tick (price change) in the tester we move in the present, the current-time triangle moves to the right onto the new known time and receives new prices. Each new tick creates the Present, increases the information about the Past and still has dark unknown Future before it. In this case the tester has no the possibility of seeing a future inherently, irrespective of mistakes, a trader could commit when writing a strategy.
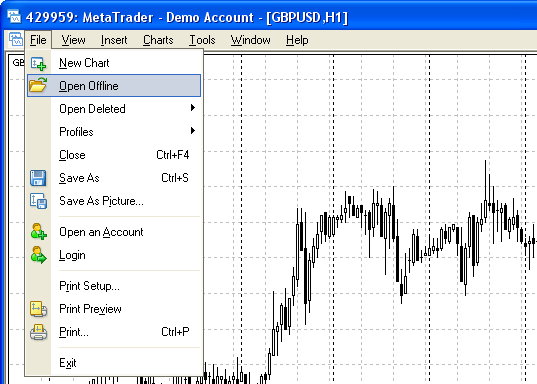
Exactly this is the difference between two approaches. The first approach of creating the tester provides the illusionary simplicity and quickness of testing, the second one gives the assurance, that all written strategies will behave absolutely the same way as in real-time trading at equal price changes. That is why the sequences, modelled for the tester, are stored as files, containing snapshots of the bar state (fxt file), which can be opened like a usual chart using the menu "File" - >> "Open Offline".
The tester files are marked by an icon with the letter G (generated) and provide the information about the type of modelling, the range of modelled price changes, number of bars and timeframe:
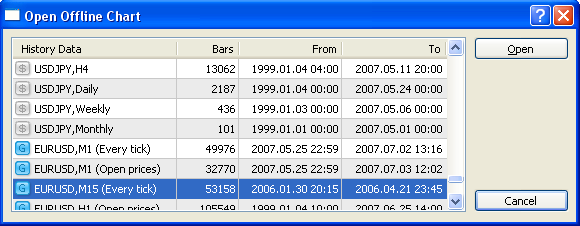
For example, if we open the file EURUSD M15, we will see the way, a 15-minute bar was modelled for the tester:
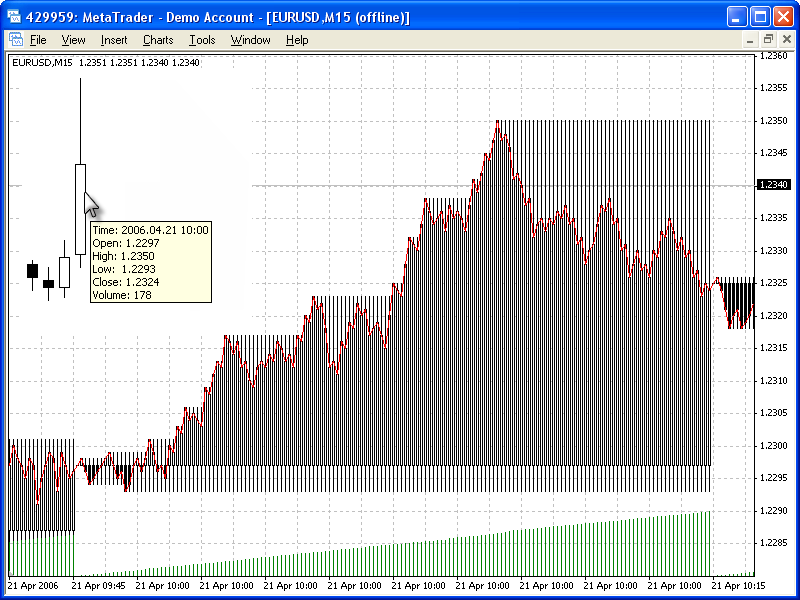
The picture shows the progress of a bar in the 15-minute timeframe. When testing an Expert Advisor, the tester saw this 15-minute candlestick (2006.04.21 10:00) exactly in such a sequence. The number of price changes on a minute bar is equal to the number of candlestick changes during testing. So, at each point of time the tester sees a correct price Open (which is fixed and is equal to Open[0]), correct maximal and minimal prices (which may change during the period of bar progress), equal to the current High [0] and Low[0], and the last known price Bid, equal to the current price Close[0], which changes before the bar closes. Volumes are also modelled maximally correctly which is obvious from the growing green histogram of volumes, like on a simple graph. The red broken line stands for the indicator Moving Average (simple moving average) with the period 1. This moving average shows the position of Close at each moment of time during testing.
Important! The tester in MetaTrader 4 processes each price change and leaves no way to dip into future.
Modelling on Different Timeframe of a Symbol Tested
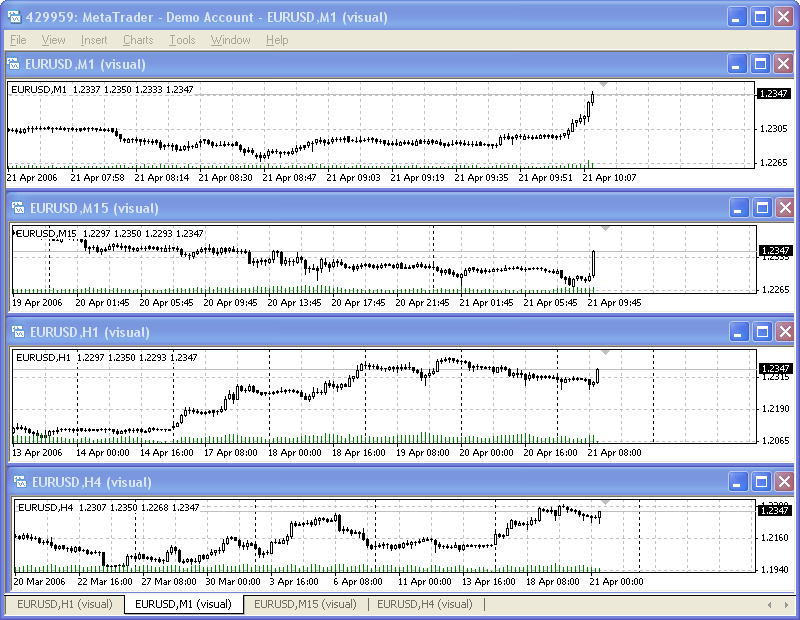
The tester in MetaTrader 4 allows seeing not only the tested timeframe, but also other - higher and lower - timeframes. Thus, if we test an Expert Advisor on the timeframe EURUSD M15, we can see the values of the indicators for EURUSD H1 or EURUSD M5. We can also see the maximal and minimal prices of the current zero bar on any available timeframe EURUSD. If we need to obtain the maximal price of the current day, we simply view the value iHigh(NULL,PERIOD_D1,0). It is like in the online trading. And it makes no difference, on which period we test the Expert Advisor or onto the chart of which time-frame it is attached in the real time mode.
Thus, the task of the tester is to model correctly not only the current timeframe, but also all other necessary timeframes. This task is solved in the tester the following way: not only the bar progress on the current zero bar is modelled, but also all other timeframes are modelled the same way. The receipt of each new tick changes the information about the zero bar condition on each timeframe, everything is done synchronously. Here is a picture:
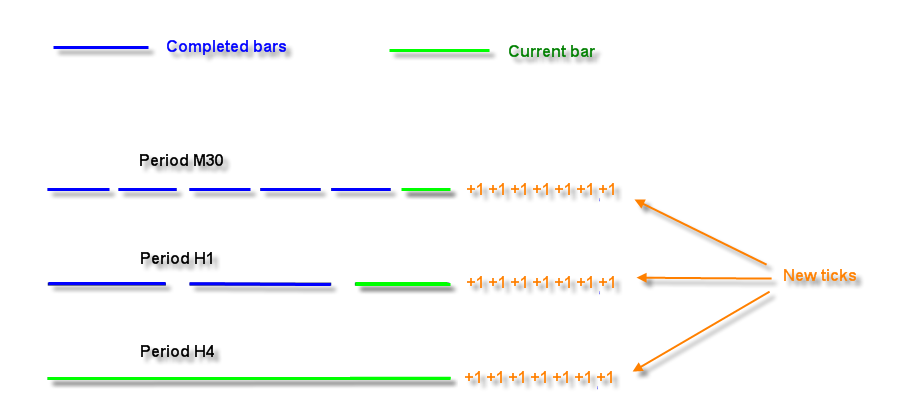
The blue color here indicates completed bars, the green color - the current changing zero bar. Figures +1 denote the receipt of a new tick. Each tick is immediately received by all necessary modelled timeframes. To make sure, you can start testing of a simple Expert Advisor CheckModelling.mq4, which shows prices available for the tester at each point of time.
All requested timeframes (and not only prices, but also volumes) are correctly modelled. The tester sees the synchronous price progress on each timeframe, like in real life:
It is clear, that the price Low for the 15-minute timeframe differes from the price Low of higher timeframes. The same is with the price High. However the price Bid on all timeframes is the same at the receipt of a new tick.
Important:all timeframes of the symbols tested are modelled also correctly - prices Open, High, Low and Close are modelled 100% correctly. Volumes of higher timeframes are also modelled 100% correctly.
Modelling Prices on Other Symbols
The amount of modelled data for an accurate testing on the history is sometimes large and may require more memory and processor resources. The tester in MetaTrader 4 does not allow carrying portfolio testing, but computer technologies are developed so fast, that, probably, soon we will be able to carry an accurate testing of complex strategies, which open positions on numerous symbols. Nevertheless, the tester in MetaTrader 4 allows receiving information about prices of other symbols, different from the tested one. But in this case the modelling is not carried, the data is extracted as it is. The zero bar is simplified to introducing on the beginning of the process the following: High[0]=Low[0]=Close[0]=Open[0], Volume[0]=1 which enables to know the price at the beginning of the bar, but no price at the end. To make sure, just test a simple Expert Advisor on EURUSD in the mode "Every tick".
//+------------------------------------------------------------------+
//|                                               CheckModelling.mq4 |
//|                      Copyright © 2007, MetaQuotes Software Corp. |
//|                                        https://www.metaquotes.net/|
//+------------------------------------------------------------------+
#property copyright "Copyright © 2007, MetaQuotes Software Corp."
#property link      "https://www.metaquotes.net/"

//---- input parameters
extern int       DayS=21;
extern int       MonthS=4;
extern int       YearS=2006;
extern int       HourS=10;
extern int       MinuteS=00;
extern int       CounterS=20;
int counter;
int start()
  {
//----
   if (counter>CounterS) return;
   if (Year()<2006) return;
   if (Month()<MonthS) return;
   if (Day()<DayS) return;
   if (Hour()<HourS) return;
   if (Minute()<MinuteS) return;
   Print("My time frame   "," Open=",Open[0],"  High=",High[0],"   Low=",Low[0],
      "  Close=",Close[0],"  Volume=",Volume[0],"  Bid=",Bid);
   Print("30 minute frame "," Open=",iOpen(NULL,PERIOD_M30,0),"  High=",iHigh(NULL,PERIOD_M30,0),
      "   Low=",iLow(NULL,PERIOD_M30,0),"  Close=",iClose(NULL,PERIOD_M30,0),
      "  Volume=",iVolume(NULL,PERIOD_M30,0),"  Bid=",Bid);
   Print("1 hour frame    "," Open=",iOpen(NULL,PERIOD_H1,0),"  High=",iHigh(NULL,PERIOD_H1,0),
      "   Low=",iLow(NULL,PERIOD_H1,0),"  Close=",iClose(NULL,PERIOD_H1,0),
      "  Volume=",iVolume(NULL,PERIOD_H1,0),"  Bid=",Bid);
   Print("4 hour frame    "," Open=",iOpen(NULL,PERIOD_H4,0),"  High=",iHigh(NULL,PERIOD_H4,0),
      "   Low=",iLow(NULL,PERIOD_H4,0),"  Close=",iClose(NULL,PERIOD_H4,0),
      "  Volume=",iVolume(NULL,PERIOD_H4,0),"  Bid=",Bid);

   counter++;
//----
   return(0);
  }
//+------------------------------------------------------------------+
Calculation of Indicators during Modelling
Ten years ago insufficient performance of home computers and working stations set restrictions on software developers. Limited operational memory, processor frequency below 100 MHz - all this allowed using only the most space-efficient kinds of calculation and testing of trading strategies. Intrabar testing did not exist at all, all necessary indicators were calculated beforehand and were tested in a ready, unchangeable form. At that time this was a single solution, which set its limitations on testing. In this approach we receive correct indicator values only for the moment of bar closing, using this data on the zero bar actually meant dipping into future.
The tester in MetaTrader 4 does not receive any calculated data, it gets only modelled price progress, and on the basis of the new incoming prices all necessary indicators are calculated in the course of testing. I.e. all indicators are calculated the same way as during online operation. This is a sufficient advantage of the tester, but if the algorithm of the indicator is not optimal, an EA testing can slow down substantially. The indicator calculation in the tester is as quick, as in the terminal, and an unoptimized algorithm can be unseen. But in the tester MetaTrader 4 during the calculation on millions of bars (a minute history of EURUSD from 1999 contains almost three million bars) any non-optimality becomes obvious. Do not forget, that every-tick modelling of a minute bar gives not one, but several ticks, each then calculated by the tester.
Nowadays processors possess gigabytes of operational memory and several-gigahertz frequency, 32-bit architecture is substituted by 62-bit systems, even multiprocessing appeared. But there are still lots of people, who operate with the categories of the last century and refer all the disadvantages of the previous generation TA programs and developers to MetaTrader 4 Tester. Such people fear intrabar modelling, they consider it to be an incorrect tester operation. The tester in MetaTrader 4 proves not only the possibility of a correct price modelling on any timeframe, but also the necessity of exactly this approach in history-based strategy testing.
You can watch the video and estimate the price progress and indicator calculation in the tester:
Important: the tester performs a real model of testing which requires certain resources.
Frequent Questions, Resulting from the Ignorance of the Correct Price Modelling in the Tester
MetaTrader 4 was officially released on the 1st of July, 2005, and since then the same questions appear in different forums, and the questions are connected with the incorrect tester operation. Here are the most frequent questions, resulting from myths about past-years testers.
- Why does my Expert Advisor, using an indicator, open trades at a wrong location?
After the testing is finished, you can use the button "Open Chart" to open a chart, reflecting all points of entry and exit, as well as the indicators that were called from the Expert Advisor. But it is often ignored, that the indicator values, at the given moment calculated on the history, may significantly differ from the values that were at the moment of testing (actually, on-line). A vivid example is the indicator ZigZag.
Opening the testing chart of the EA, where this indicator was used, we can see clearly all the breaks of the ZigZag. One could expect a good profit from a strategy, based on the tracking of such breaks on the zero bar. Those who do not understand the MT4 tester operation principle erroneously think, that such strategy should show the absolute profit in the tester, because in other TA programs future is seen for such strategies. But we do not see any profit, moreover the trades are opened at a wrong location! Start testing in the visual mode, attach to the chart all indicators used by the EA - and illusions will dissolve! This does not require special knowledge - the tester will display everything in the visual mode. Here is the example of such an EA - ExpertZigzag:
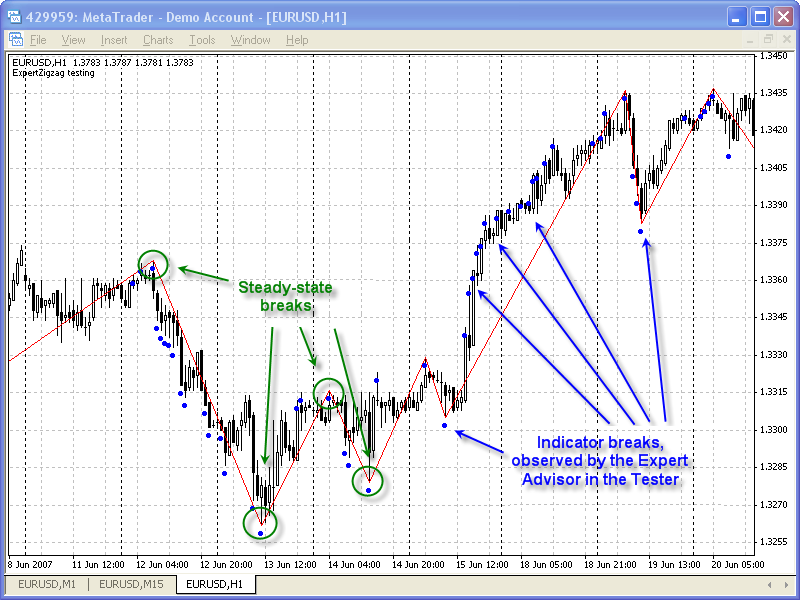
Important: if you are uncertain about the correctness of the tester operation, use the visual testing. You will see the process of testing as it really is, and not as you think it to be.
- Why are the indicator values in testing and the indicator values in the on-line chart are not equal?
One of the mistakes during indicator writing is an incorrect calculation of the indicator values and paralogism. As a result, the indicator starts "lying" and collecting mistakes. In other words, yesterday the indicator showed values, different from today's ones in the same period.
The mistake of such indicators can be also seen in the on-line operation of the indicator. For example, we attach the indicator to a 15-minute chart, wait for the appearance of 3-4 new bars and then attach one more such indicator, but using other colors. The difference is very often seen visually. Here is an example of such an incorrect indicator:
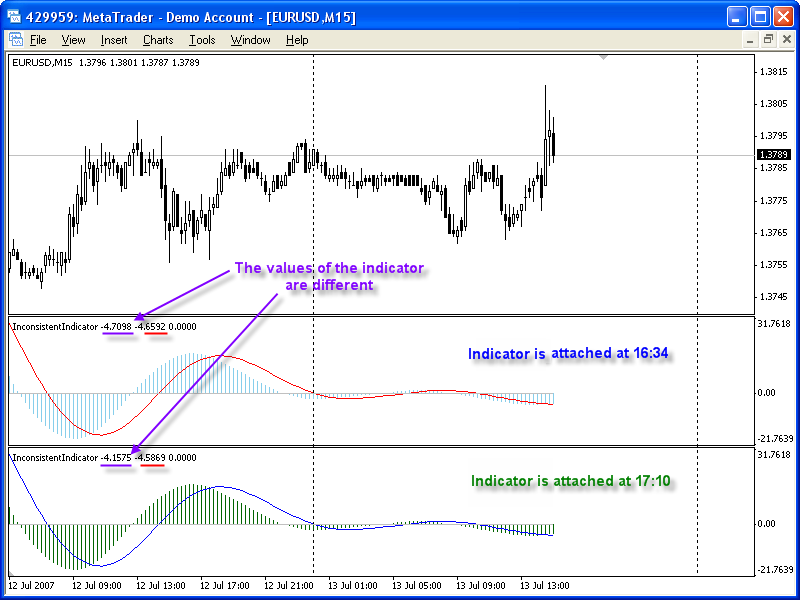
Important: indicators are calculated in the course of testing, like during the online operation, that is why all mistakes in the indicator's logic become apparent in the process of testing!
- Why does my EA see wrong prices of a higher timeframe, though I have imported my own deep history?
For modelling the tester uses data from fxt-file. Usually this fxt-file is generated by the tester on the basis of the available history in hst-files. But if the prepared FXT-file was generated in another time-zone, or on the other broker's quotes (or prepared by yourself - the format of fxt-files is open), and the data in this fxt-file does not correspond with the data in the existing hst-files - different errors may occur. Usually this may happen after a manual import and reconversion of quotes from side sources.
For example, the EA calls the function iOpen(NULL, PERIOD_D1,1) or iHighest(NULL, PERIOD_D1,MODE_HIGH,20,1). iOpen(NULL, PERIOD_D1,1) requests the yesterday open price on the same symbol, on which the testing is carried. iHighest(NULL,PERIOD_D1, MODE_HIGH,20,1) gives the index of the daily bar with the largest value of High within 20 bars starting from the first one (of yesterday). Both functions in the tester are calculated on the basis of the data from hst-files.
And if the fxt-file does not correspond with the history in hst-files (in this example data on EURUSD1440.hst), the prices in the tester will be absolutely different. We have two different histories - the one is in the tester, the other one is in the file EURUSD*hst.
Important: a correct testing requires correspondence between data in fxt- and hst- files. It is undesirable to use patch import from side sources. Use standard History Center with minute history of quotes from 1999. Minute quotes from the History Center are automatically recalculated onto all timeframes and are converted into the time-zone of the current account which eliminates "time shifting".
- Why after the import of my quotes, indicators from higher timeframes lie in the tester?
While only the zero bar prices are modelled, values of standard and custom indicators on other bars are calculated on the basis of data from hst-files. I.e. correct indicator values cannot be calculated without correct source price data from other timeframes.
Important: before starting the testing make sure that all necessary price data of other timeframes is pumped, and that this data is correct. Standard History Center provides the correctness of all timeframes, because it automatically recalculates from the minute data all other periods.
Conclusion
The tester in MetaTrader 4 is the result of a long-term experience of writing several generations of trading terminal since year 2000. Everything was done for providing a trader with an opportunity to test strategies with maximal possible correctness. This eliminates the necessity of a several-month testing of trading ideas in the real time mode. But knowing all the tester's options helps you save time and better realize the importance of a correct indicators and EA's development.
Translated from Russian by MetaQuotes Ltd.
Original article: https://www.mql5.com/ru/articles/1490
Warning: All rights to these materials are reserved by MetaQuotes Ltd. Copying or reprinting of these materials in whole or in part is prohibited.

 Non-standard Automated Trading
 Interaction between MetaTrader 4 and Matlab via CSV Files
 Testing Visualization: Account State Charts
 Sending Trading Signals in a Universal Expert Advisor
- Free trading apps
- Over 8,000 signals for copying
- Economic news for exploring financial markets
You agree to website policy and terms of use
First of all thanks for the article. It really helped me to understand the results obtained during testing and to trust the testing process (do have to be careful with my own indicators thought :p)
I have a question regarding "Modeling on a diferent timeframe of a symbol tested".
I'm trying to test an EA that uses multiple timeframes, but I'm having trouble viewing both charts. According to the snapshot in the article your able to follow sereval timeframes for the same symbol in "Visual Mode", could you drop a hint on how to open multiple timeframe charts?
Thanks,
SC
Thank you .it is very useful.
This article has clarified a number of things on how the price modelling works in the Strategy Tester. It suggests that price is modelled across all timeframes for the symbol being tested.
I've been trying to get offline charts with multiple timeframes updated by the tester chart, but to no avail. I'd be grateful if someone could clarify how the MTF charts can be displayed synchronously with the ticks on the testing chart as shown in this article.
Regards
Narayan