
How Not to Fall into Optimization Traps?
It would be nice to develop trading systems without giving a thought to optimization.
Realistically, however, the development of a profitable trading strategy
is a trial-and-error activity in which some form of optimization always plays a
role.
There is always an optimizer around somewhere-if not visible on the table, then
lurking in the shadows.
J. Katz, D. Mccormick. The Encyclopedia of trading Strategies.
What Is Optimization of a Trading System?
Creation of a trading system, first of all, consists in formulation of rules that would open and close a long or a short position. These rules usually contain some indicators and parameters. If they are changed, the profitability of the trading system will change, too. The question occurs very frequently: Is there any necessity to optimize trading systems or is this just fitting the system to historical data?
This most probably attaches to the fact that different people may mean absolutely different procedures under "optimization of a trading system". So let us define first what optimization is.First, we may understand by "optimization" the selection or creation of a trading system that would solve our problems better than other systems. For example, we are searching for such a system that would make the largest profit on yen/US dollar at the moment. For this, we will choose a system with some fixed parameters from a certain variety of systems. This may be, for instance, a choice made among systems based on different indicators. Let's call this the "first-type optimization".
Second, we can understand by "optimization" the finding of such parameters for the selected trading system that would allow us to obtain the best results. This may be selection of period to calculate the average or period to calculate stochastic structures. Let us call this "second-type optimization".
I suppose nobody doubts about that traders creating a trading strategy try, explicitly or implicitly, to use both types of optimization. Indeed, as soon as we select a trading system to work with, we hereby presume that we will use the best trading system we possess. I.e., we use the first-type optimization. However, since any system has some parameters, we try to search for values for these parameters in such a way as to get the best results. This is obviously the second-type optimization. Moreover, it is impossible to separate these two optimization types when creating a trading system. This is why the answer to the question about whether to use optimization when creating a trading system or not is clear: Optimization must be used. Another matter is how to do this. There are several stages in creation of a trading system:- starting up the idea of what would underlie the trading system;
- selection of criteria or decision rules;
- defining parameters of the system;
- testing the system; and
- returning to previous clauses if it is necessary to make changes in the system.
Problems of the Second-Type Optimization
When creating an automated trading system, all developers use both first-type and second-type optimization. Search for criteria and decision rules is a task for heuristic systems like neural networks, genetic algorithms, and, of course, human brains - the most powerful system existing at present. This is the first-type optimization, so the entire responsibility for this optimization lies on traders.The second-type optimization is the search for the best parameters. It is here where
the problems occur since it is very easy to fit the data to the history and gain
"huge profits". Unfortunately, this works on history only. Such an "overoptimization"
can be hardly avoided, so some traders start to feel negatively towards it. Why?
How Can the Overoptimization Problem Be Solved?
What shall we do? We may not neglect optimization since we will then omit the best solution or a potentially profitable strategy due to wrongly found parameters.However, oberoptimization will result in serious problems, too. We have to find the golden mean.Let us approach to optimization mathematically. In general, when there are rather
many parameters to optimize, we search for a hyperplane within which the profit
is stable and changes more or less equally when parameters are slightly modified.
At optimization, we try to find such a solution for which profits are the highest
and insignificant deviations from the optimal solution don't result in sharp changes
in profit.
Unfortunately, there is still no algorithm embedded in MetaTrader that would search for optimal solutions by itself. One of the most powerful algorithms that solve such problems is KRAB. It is described in the book by N. Zagoruyko, Applied Methods of Data and Knowledge Analysis. Novosibirsk: Institute of Mathematics Press, 1999 (in Russian). It would be great if it were realized in the next builds… But everything is not bad!
MetaTrader can construct an optimization graph for one or two parameters to be optimized. This means that projecting the optimization results into a plane we, in theory, can find the optimal solution. In other words, optimizing two parameters by two we find the best solution region.For three parameters, we will have to repeat this procedure
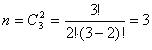
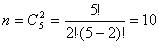
However, for five parameters, this will be
When optimizing two parameters, we obtain an optimization graph like this one below:
The graph below is not so unambiguous: We can see two areas containing maximums
in this graph. What should we choose?
An experienced eye will notice the solution region in the lower right corner since
the area of neighboring squares shows totally smaller fall of profits than that
at the beginning of the graph. So I'd recommend you to analyze graphs attentively
in order to save your deposit.
Let's start to study a simple Expert Advisor – analyze three parameters and find an optimal solution region. The name of the EA is SP. It works in the areas of overbought/oversold markets analyzing momentum.
//+------------------------------------------------------------------+
//|                                                           SP.mq4 |
//|                      Copyright © 2006, MetaQuotes Software Corp. |
//|                                        https://www.metaquotes.net |
//+------------------------------------------------------------------+
#property copyright "Copyright © 2006, MetaQuotes Software Corp."
#property link      "https://www.metaquotes.net"

//---- input parameters
extern int       TakeProfit=50;
extern int       StopLoss=30;
extern int       RsiLen=4;
extern int       KLen=8;
extern int       Momlength=10;
extern int       Lots=1;
extern int       rsi_oversold=39;
extern int       stoc_oversold=29;
extern int       rsi_overbought=60;
extern int       stoc_overbought=70;
extern int       Mom_Sell=-2;
extern int       Mom_Buy=2;

int expertBars;
double RSIlevel;
double Stoclevel;
double MomLevel;
double DLen=3;

//+------------------------------------------------------------------+
//| returns true if a new bar has come, otherwise returns false      |
//+------------------------------------------------------------------+
bool isNewBar()
  {
//----
   bool res=false;
   if (expertBars!=Bars)
      {
      expertBars=Bars;
      res=true;
      }
//----
   return(res);
  }
//+------------------------------------------------------------------+
//| expert initialization function                                   |
//+------------------------------------------------------------------+
int init()
  {
//----

//----
   return(0);
  }
//+------------------------------------------------------------------+
//| expert deinitialization function                                 |
//+------------------------------------------------------------------+
int deinit()
  {
//----

//----
   return(0);
  }
//+------------------------------------------------------------------+
//| expert start function                                            |
//+------------------------------------------------------------------+
int start()
  {
  double price;
  double stop;
  double profit;
//----
   if ((isNewBar())&& (OrdersTotal()==0)&& (AccountBalance()>5000))
   {
      RSIlevel=iRSI(NULL,0,RsiLen,PRICE_CLOSE,0);
      Stoclevel=iStochastic(NULL,0,KLen,DLen,3,MODE_SMA,0,MODE_MAIN,0);
      MomLevel=100 - iMomentum(NULL,0,Momlength,PRICE_CLOSE,0);
      /*if (AccountBalance()>50000)
         {Lots=NormalizeDouble( AccountBalance()/10000,0)-4;}
      else
         Lots=1;*/
      if ((RSIlevelrsi_oversold)&&(Stoclevelstoc_oversold)&&(MomLevel>Mom_Sell))
      {
         price=Ask;
         stop=NormalizeDouble(price-StopLoss*Point,Digits);
         profit=NormalizeDouble(price+TakeProfit*Point,Digits);
         OrderSend(Symbol(),OP_BUY,Lots,price,3,stop,profit,NULL,0,0,Green);
         //Print(AccountBalance());
      }
      if ((RSIlevel>rsi_overbought)&&(Stoclevel>stoc_overbought)&&(MomLevelMom_Buy))
      {
         price=Bid;
         stop=NormalizeDouble(price+StopLoss*Point,Digits);
         profit=NormalizeDouble(price-TakeProfit*Point,Digits);
         OrderSend(Symbol(),OP_SELL,Lots,price,3,stop,profit,NULL,0,0,Green);
         //Print(AccountBalance());
      }
   }

//----
   return(0);
  }
//+------------------------------------------------------------------+
We optimize three parameters – Stochastic and RSI periods and the StopLoss level.
Dependence of profits from RSI and StopLoss.
The best regions are:
- Graph 1 – (4;5)&(3;6);
- Graph 2 – (80;90)&(3;6);
- Graph 3 – (80;90)&(4;5).
Combining them, get the best solution – (5,4,80).
It should be noted that StopLoss has a larger step of ten at optimization. If it is necessary, the obtained solution can be analyzed with a smaller step, too.Conclusion
This is very good, of course, that green color saturation of a cell allows us to judge about how profitable the region is. However, it will be even better if losing regions will be proportionally colored in red. This will help us to estimate the strategy at an absolutely other level. In fact, we obtain the full three-dimensional picture of optimization!Lastly, some recommendations for optimization:
- Data sample for optimization must be representative. It must exceed 3 years for Daily timeframe.
- Test your strategy outside the optimization sample – this will allow you to estimate the selected parameters.
- Don't optimize too many parameters at the same time – the probability of fitting for history will be too high.
- Increase the step in order to reduce optimization time. The best region will not be neglected. The obtained cluster can be analyzed in more details later (sieving technique).
- Don't spend hours on optimization – you'd better modernize the Expert Advisor's algorithm.
Translated from Russian by MetaQuotes Ltd.
Original article: https://www.mql5.com/ru/articles/1434
Warning: All rights to these materials are reserved by MetaQuotes Ltd. Copying or reprinting of these materials in whole or in part is prohibited.
This article was written by a user of the site and reflects their personal views. MetaQuotes Ltd is not responsible for the accuracy of the information presented, nor for any consequences resulting from the use of the solutions, strategies or recommendations described.
 Filtering by History
 Universal Expert Advisor Template
 Trading Using Linux
 Principles of Time Transformation in Intraday Trading
- Free trading apps
- Over 8,000 signals for copying
- Economic news for exploring financial markets
You agree to website policy and terms of use
Hi,
As I understood, one should optimize regularly in order to take into account market changes (volat, etc...) --> ie. optimize during one year, then trade 3 months, and so every three months....
We would therefore need a way to select the optimal parameter in a "industrial" way, like with precise rules, not a graph observation.
For example: take the 25 best profits, with some restriction on # of trades, P/R,... and take the average parameter value of these 25 best-profit-combinations?
I would like to find a automated way to choose the right parameters combination in Excel...
If I was not clear, let me know, I will explain it more clearly.
See ya all.
Best
" Combining them, get the best solution – (5,4,80). "
I don't understand how to to choose best solution with 3 parameters Or more ? can anybody explain this ?
Optimization traps are situations where you optimize for something that is not actually important, or you optimize too much and end up making things worse. Here are some tips on how to avoid optimization traps:
By following these tips, you can avoid optimization traps and ensure that your optimization efforts are successful.
Here are some additional tips to avoid optimization traps:
By following these tips, you can increase your chances of avoiding optimization traps and achieving your optimization goals.