
Price Forecasting Using Neural Networks
Introduction
During the last several years we observe the explosion of interest towards neural networks, successfully used in different spheres - business, medicine, technology, geology, physics. Neural networks are widely used in spheres that require forecasting, classification and management. Such an impressive success is determined by several reasons:
- Wide possibilities. Neural networks are a very powerful modelling tool, allowing the reproduction of immensely complicated relations. In particular, neural networks are nonlinear by nature. Over a period of many years linear modelling was the main method of modelling in the majority of spheres, because optimization procedures for it are well developed. In tasks, where linear approximation is not enough, linear models operate poorly. Besides, neural networks overcome "the curse of dimensionality", which does not allow modelling linear relations in case of a large number of variables.
- Easy usage. Neural networks learn by examples. The user of a neural network collates representative data and then starts the algorithm of training, which automatically accepts the data structure. Of course the user should have a set of heuristic knowledge about the way of selecting and preparing data, of choosing the appropriate network architecture and interpreting results. However, the knowledge level, needed for a successful use of neural networks, is much lower, than that needed in traditional statistics methods.
Neural networks are attractive from the point of view intuition, because they are based on the primitive biological model of nervous systems. In future, the development of such neuro-biological models can lead to the creation of really intelligent computers. [1]
Forecasting financial time series is a primary member of any investment activity. The whole idea of investment - investing money now with the purpose of getting profit in future - is based on the idea of forecasting future. Accordingly, forecasting financial time series lies at the root of the investment industry - all stock exchanges and over-the-counter (OTC) markets.
It is known, that 99% of all trades are speculative, i.e. are aimed not at a real
trade turnover, but at taking profit using the scheme "buy cheap - sell dear".
They are all based on the forecasts of price movements by a trade participants.
What is important - forecasts of the trade participants are contrary to each other.
So the amount of speculative operations characterizes the difference in the forecasts
of the market participants, i. e. actually - the unpredictability of financial
time series.
This most important feature of market time series underlie the theory of the "efficient" market, described in the thesis of L. Bachelier in 1900. According to this thesis, an investor can rely only on the average market profitability, assessed by indexes, like Dow Jones or S&P500 for New-York Exchange. Any speculative profit is of random nature and is like gambling (there is something attractive in it, isn't there?). The reason for the unpredictable nature of market curves is the same, as why money rarely lies on the ground in public places: too many people wishing to take it.
Naturally, the theory of an efficient market is not supported by the market participants
(which are looking for the money lying about). Many of them think that, despite
the seeming stochasticity, all time series are full of hidden regularities, i.e.
are predictable, at least partially. The founder of a wave analysis R. Elliot tried
to find such hidden empirical regularities in his articles in the 30s.
In the 80s this point of view was unexpectedly supported in the newly appeared theory of dynamic chaos. This theory is based on the contraposition of the chaotic state and stochasticity (randomness). Chaotic series only seem random, but as a deterministic dynamic process they allow short-term forecasting. The sphere of probable forecasting is restricted in time by the horizon of forecasting, but this can be enough for getting real profit from forecasting (Chorafas, 1994). And those, who use the best mathematics methods of extracting regularities from noisy chaotic series, can expect large profits - at the expense of less equipped fellows.
The last decade was characterised by a persistent growth of the popularity of technical analysis - a set of empirical rules, based on different indicators of the market behaviour. The technical analysis focuses on the individual behaviour of this financial instrument, apart from other securities. But technical analysis is very subjective and works inefficiently on the right edge of a chart - exactly where we need the forecast of a price direction. That is why more popularity is gained by the neuro-network analysis, because, as opposed to the technical one, it does not set any restrictions on the type of the entry information. This may be indicators of the given indicator series, as well as the information about the behaviour of other market instruments. Not in vain neural networks are widely used by institutional investors (for example large pension capital funds), working with large portfolios, placing great importance on the correlation between different markets.
Pure neuro-network modelling is based only on data, not using any antecedent arguments. This is its strong and week point at the same time. The available data may be insufficient for training, dimensionality of potential entries may be too large.
That is why for a good forecast one should use neuropackages with large functionality.
Preparing Data
To start the operation we should prepare data. The correctness of this work influences 80% of success.
Guru of neural networks say, that as entries and exits one should not use the values of quotes Ct. What is really significant is the quotes' changes. While the amplitude of these changes is as a rule smaller than the quotes themselves, there is a strong correlation between the successive quotation values - the most probable quotation value in the next moment will be equal to its previous value C(t+1)=C(t)+delta(C)=C(t).
Meanwhile, for a higher training quality we should aim at a statistic independence of entries, i.e. avoiding such correlations. That is why it is logical to choose as entry variables statistically most independent values, for example quote changes delta(C) or relative increment logarithm log(C(t)/C(t+1)).
The last choice is better for long time series, when the influence of inflation is sensible. In such a case simple differences in the parts of the series will have different amplitude, because they are actually valued in different units. And on the contrary, the relations of successive quotes do not depend on the measurement units and will be of the same scale regardless of the inflationary change of measurement units. As a result, the large stationarity of the series enables using for training a large history, thus providing better training.
The disadvantage of the immersion into the lag space is the restricted "eyesight"
of the net. On the contrary, the technical analysis does not fix a window in the past, and at times uses far series values. For example maximal and minimal
series values even in the relatively far past are claimed to have a large impact
on the traders' psych, and consequently must be valuable for forecasting. A not
wide enough window of the immersion into the lag space is not able to provide such
information, which, naturally, lowers the efficiency of forecasting. On the other
side, widening the window to such dimensions, when it includes far extreme series
values, increases the dimensionality of the net, which results in a worse accuracy
of neuronet forecasting.
The way out of this seemingly dead-locked situation is alternate methods of coding of the past behavior of the series. Instinctively it is clear, that the the further in the past goes the series history, the less details of its behaviour influences the result of forecasting. It is based on the psychology of the subjective perception of the past by traders, who actually make the future. Consequently, we need to find the presentation of the series dynamics, which would have a selective accuracy: the further in future, the less details, though preserving the general form of the curve.
A quite promising tool here can be a wavelet decomposition. In terms of informativity
it is equal to the lag immersion, but easier accepts such data compression, which
describes the past with the selective accuracy.
Choosing Software
There are different software, intended for working with neural networks. Some of them are more or less universal, others are highly specialized. Here is a short list of some programs:
1. Matlab is a desktop laboratory for mathematic calculations, designing electric circuits and modelling complex systems. It has an built-in programming language and a large set of tools for neural networks - Anfis Editor (education, creating, training and graphic interface), command interface for programming networks, nnTool - for a more precise configuration of a network.
2. Statistica is a powerful software for analyzing data and searching statistic regularities. In this package the work with neuronets is presented in the block STATISTICA Neural Networks (abbreviated, ST Neural Networks, neuro-net packag of the company StatSoft), which is a realization of the whole set of neuronet methods of data analysis.
3. BrainMaker is intended for solving tasks, which yet have no formal methods and algorithms, with incomplete, noisy and contradictory entry data. To such tasks we refer exchanges and financial forecasting, modelling crisis conditions, pattern recognition and others.
4. NeuroShell Day Trader is a neuronet system that meets the specific requirements of traders and is quite easy to use. This program is highly specialized and is intended for trading, though actually is very close to a blackbox.
5. Other programs are less popular.
For the primary operation Matlab is quite suitable. We will try to define the fitness of a neuronet for Forex forecasting.
The information about MatLab complex can be found in wikipedia at https://en.wikipedia.org/wiki/MATLAB
A lot of information about the program is on the web-site http://www.mathworks.com/You can buy the program at http://www.mathworks.com/store/
Experiment
Preparing data
Data is easily acquired using standard tools of MetaTrader:
Service -> Quotes archive -> Export
As a result we get *.csv file, which is a raw material for preparing data. To transform the file into a convenient for operation *.xls file, import data from *.csv file. For this purpose in excel make the following:
Data -> Import external data -> Import data and indicate the prepared primary file. In the import master all the necessary actions are done in 3 steps:
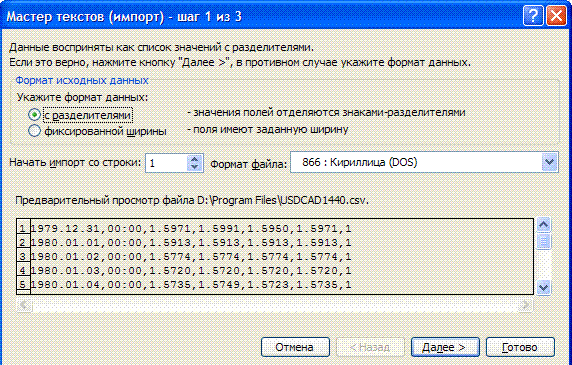
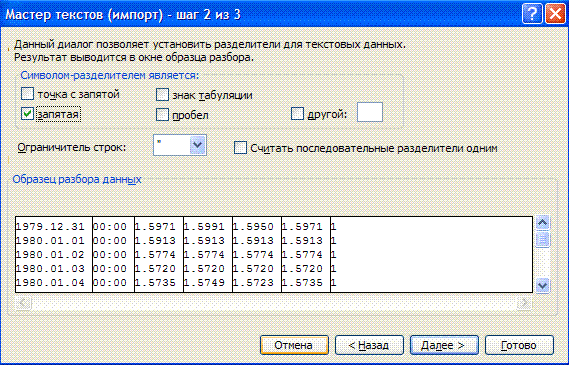
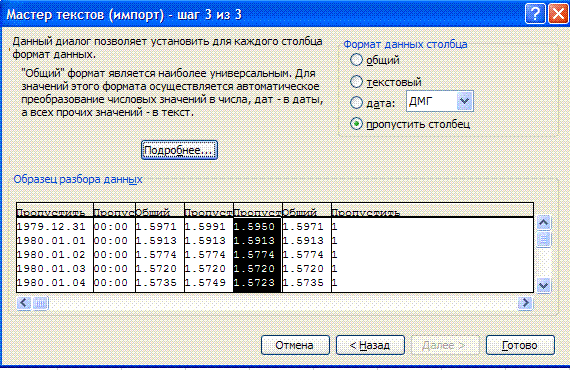
On the third step substitute the separator of the integer and the decimal part
by a point, using More...
To have data accepted as numbers, not strings, substitute the separator of the integer and the decimal part by a point:
Service -> Parameters -> International -> Separator of integer and decimal part.
The screenshots show the example of saving opening and closing prices, other data is not needed yet.
Now transform all the data in accordance with what we want to forecast. Let us forecast
the closing price of the following day upon the four previous ones (the data are
presented in five columns, prices are in a chronological order).
1.2605 |
1.263 |
1.2641 |
1.2574 |
1.2584 |
1.2666 |
1.263 |
1.2641 |
1.2574 |
1.2584 |
1.2666 |
1.2569 |
1.2641 |
1.2574 |
1.2584 |
1.2666 |
1.2569 |
1.2506 |
1.2574 |
1.2584 |
1.2666 |
1.2569 |
1.2506 |
1.2586 |
1.2584 |
1.2666 |
1.2569 |
1.2506 |
1.2586 |
1.2574 |
Thanks to easy manipulations in Excel, data is prepared within a couple of minutes.
An example of a prepared data file is attached to the article.
To have Matlab perceive the files, the prepared data must be saved in *.txt or *.
dat files. Let us save them in *.txt files. Then each file should be split - for the net training (selection) and its
testing (outside selection). Suchwise prepared euro.zip data are suitable for further operation.
Acquaintance with Matlab
From the command line start the package ANFIS using anfisedit command. The editor consists of four bars - for data (Load data), for net generation (Generate FIS), for training (Train FIS) and for its testing (Test FIS). The upper bar is used for previewing the neuronet structure (ANFIS Info).
more information about the package operation is here:
http://www.mathworks.com/access/helpdesk/help/toolbox/fuzzy/
To start the operation load data, prepared at the previous stages - clock Load Data and indicate the file with the selection data. Then create a neural network clicking
Generate FIS.
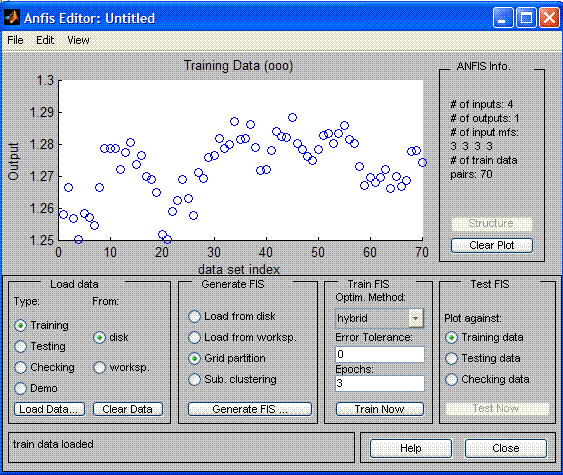
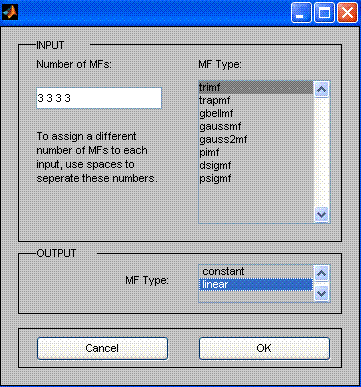
For each entry variable set 3 linguistic variables with a triangle reference function.
Set a linear function as a function of reference of an exit function.
For neuronet training the package AnfisEdit includes 2 training algorithms - back
propagation and a hybrid one. With a hybrid training the net is trained within
two-three runs. On a training selection (60 values) after training, the forecast
by the net differs from the real one in several points.
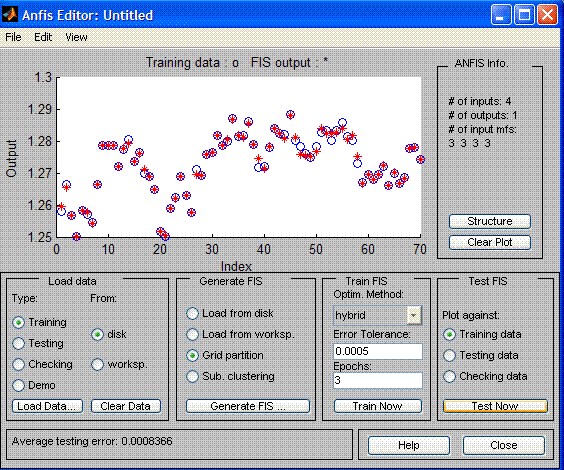
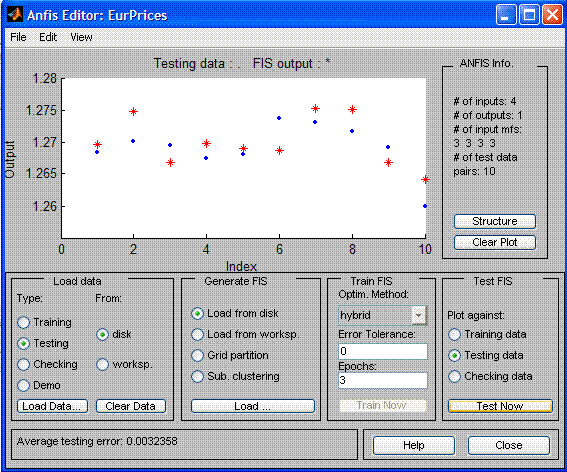
But what we need to forecast is future! As the outside-selection data we took the
next 9 days after the inside-selection data. On the outside-selection data the
mean-square-error made 32 points, which is, of course, unacceptable in the real
trading, but it shows that the neuronet direction can be further developed - the
game must be worth the candle.
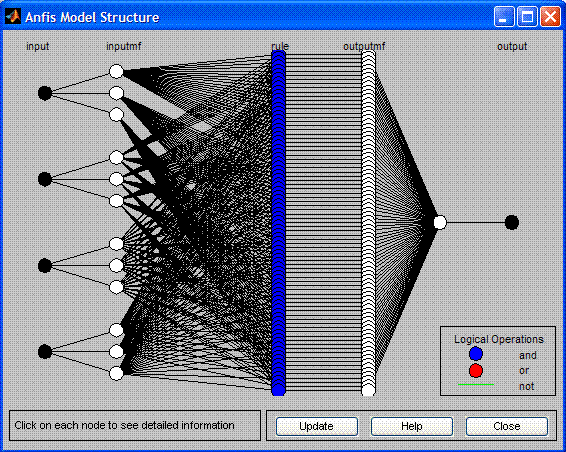
The result of our work is the multilayer hybrid neural network that can forecast
absolute price values for the near future. It cardinally changes in its architecture
and purposes from a one-layer neural network, described by Y. Reshetov in his article
/ru/articles/1447 and realized as an Expert Advisor https://www.mql5.com/ru/code/10289.
We managed to receive a more or less tolerable forecast on quotes, though neural
network experts strongly recommend not to do this. To view the resulting neuronet
click Structure. A trained neural network is located in the attached file neuro.zip .
Conclusion
Neural networks are a very powerful tool for working in financial markets, but learning this technology requires time and effort no less than learning technical analysis.
An advantage of neural networks is their objectivity in decision making, their disadvantage - the decisions are actually made by a black box.
The main problem that may occur during the work with this technology is connected with the correct pre-processing of data. This stage plays a crucial role in data forecasting and many unsuccessful attempts to work with neural networks are connected with this stage.
In order to learn properly networks one has to experiment a lot - but the game is worth the candle. If institutional investors use this tool, then common traders also can try to succeed using trained neural networks, because anything can be input to the network - from indicators and prices till signals of the fundamental analysis.
List of References
1. Nejrokompyuting i ego primenenie v nauke i biznese. A. Ezhov, S. Shumskij. 1998
Translated from Russian by MetaQuotes Ltd.
Original article: https://www.mql5.com/ru/articles/1482
Warning: All rights to these materials are reserved by MetaQuotes Ltd. Copying or reprinting of these materials in whole or in part is prohibited.
This article was written by a user of the site and reflects their personal views. MetaQuotes Ltd is not responsible for the accuracy of the information presented, nor for any consequences resulting from the use of the solutions, strategies or recommendations described.
 Practical Use of the Virtual Private Server (VPS) for Autotrading
 ZUP - Universal ZigZag with Pesavento Patterns. Part 2
 How to Cut an EA Code for an Easier Life and Fewer Errors
 Strings: Table of ASCII Symbols and Its Use
- Free trading apps
- Over 8,000 signals for copying
- Economic news for exploring financial markets
You agree to website policy and terms of use
Hi
Do enjoy your lessons, pls could i have further access to study materials on Nueral Networks from you darling Shashev Sergei?
Hi Shashev,
I have a few questions from your using Anfis Editor:
1. How to make Anfis Editor have more than 1 output? Is 1 output the limit?
2. In Anfis Editor, what are the number of MFs, MF type, and output MF type (constant/linear)
Thanks! I hope you can read this msg to answer it because your article is very insightful