KT Forex Trend Rider MT5
- Indikatoren
-
KEENBASE SOFTWARE SOLUTIONS
 Keenbase Trading entwickelt professionelle MetaTrader 4- und MetaTrader 5-Indikatoren sowie Expert Advisors, die Trader dabei unterstützen, fundiertere Handelsentscheidungen zu treffen.
 - Version: 1.0
- Aktivierungen: 5
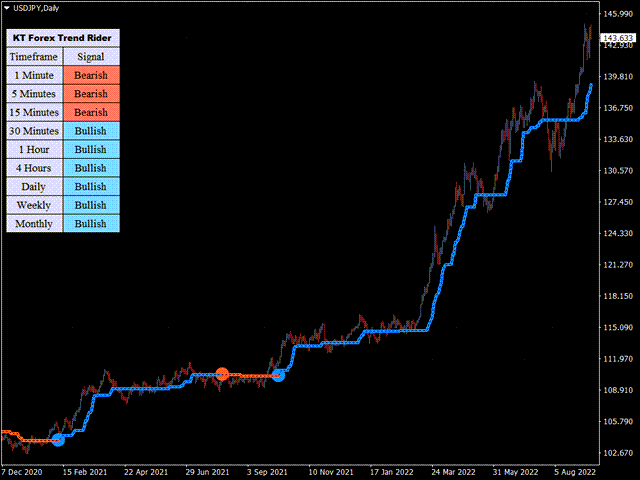
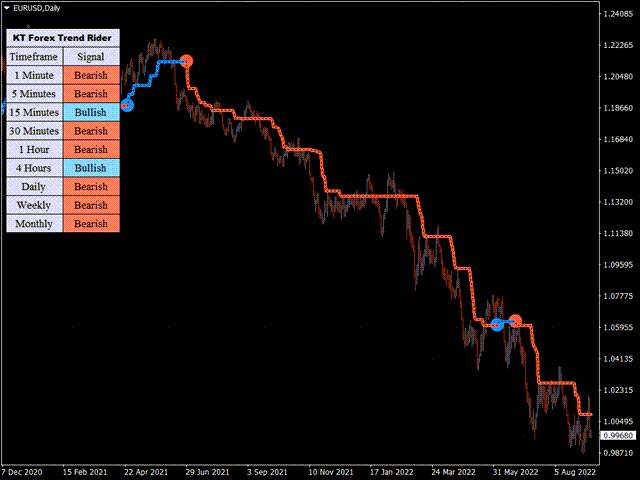
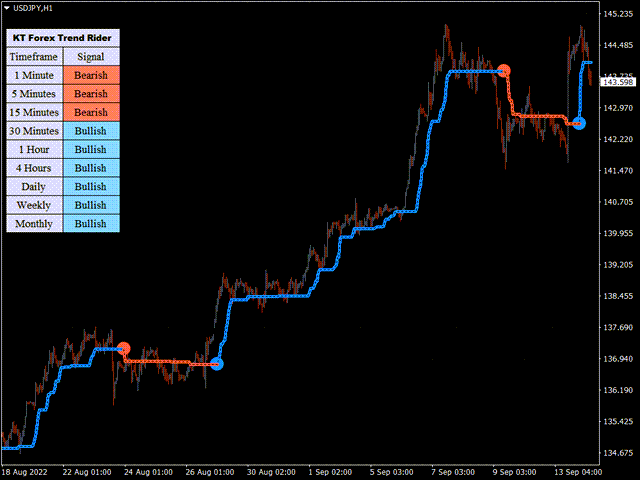
Der KT Forex Trend Rider verwendet einen speziell für den Forex-Markt entwickelten Trendfolge-Algorithmus, der zuverlässige Kauf- und Verkaufssignale für die wichtigsten Währungspaare liefert. Er funktioniert am besten für die wichtigsten FX-Paare und alle Zeitrahmen.
Eigenschaften
- Es verfügt über einen Multi-Timeframe-Scanner, der über alle Zeitrahmen hinweg nach neuen Signalen suchen kann.
- Er verfügt über vier voreingestellte Profile, die den Handel für Scalper, Tick-Trend-, Swing- und Trend-Trader erleichtern.
- Es markiert die potenziellen Umkehrpunkte auf dem Markt.
- Er kann sowohl den Anfang als auch das Ende eines Trends anzeigen.
- Es wird mit allen Metatrader-Warnungen geliefert.
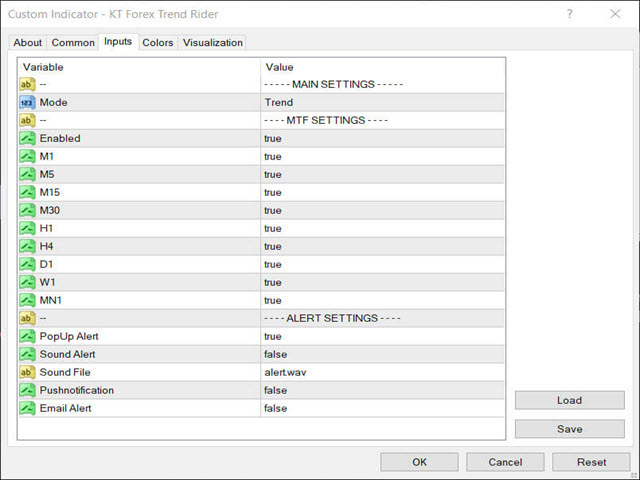
Eingaben
- Modus: Scalper/Tick/Swing/Trend
- MTF-Scanner-Einstellungen
- Alert-Einstellungen