KT Forex Trend Rider MT5
- Indicadores
-
KEENBASE SOFTWARE SOLUTIONS
 Keenbase Trading desarrolla indicadores profesionales y Asesores Expertos (Expert Advisors) para MetaTrader 4 y MetaTrader 5, diseñados para ayudar a los traders a tomar decisiones de trading más informadas.
 - Versión: 1.0
- Activaciones: 5
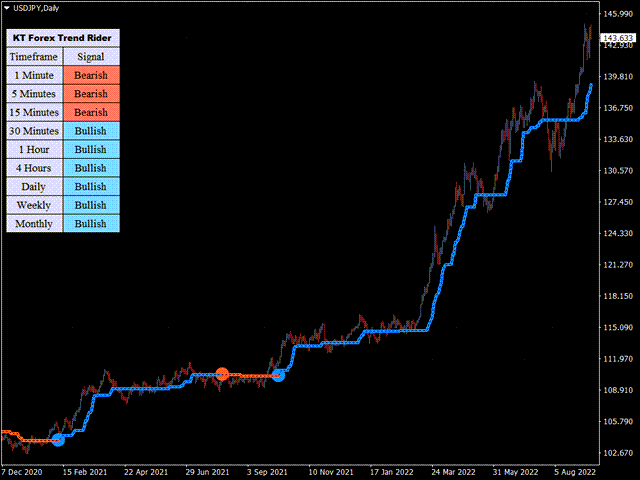
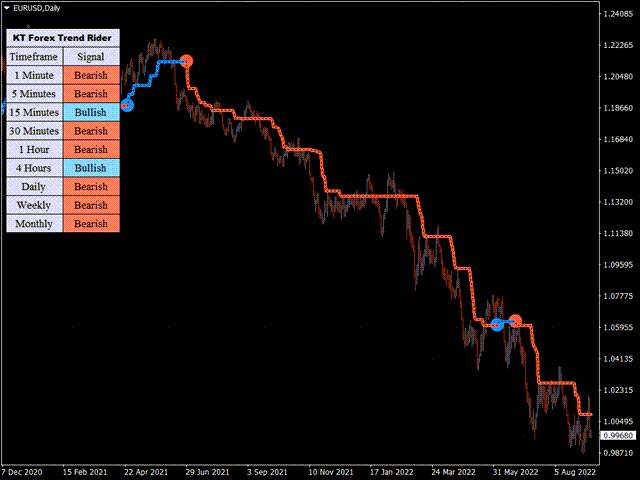
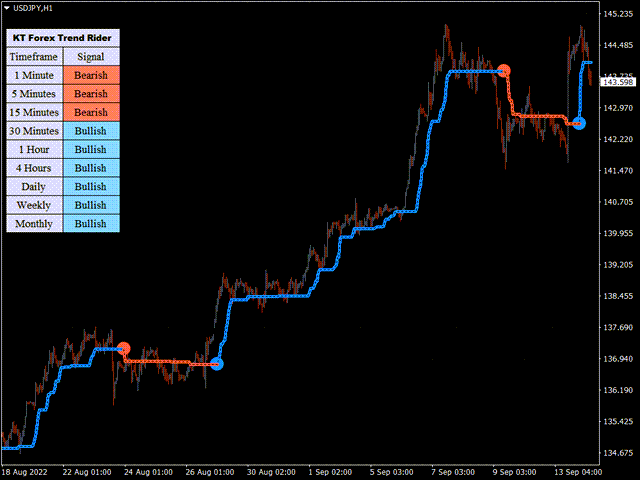
KT Forex Trend Rider utiliza un algoritmo de seguimiento de tendencias desarrollado específicamente para el mercado Forex para proporcionar señales fiables de compra y venta en los principales pares de divisas. Funciona mejor en los principales pares de divisas y en todos los plazos.
Características
- Viene con un escáner Multi-Timeframe que puede buscar las próximas señales a través de todos los plazos.
- Viene con cuatro perfiles preestablecidos para facilitar el comercio para los revendedores, tick-tendencia, swing, y la tendencia de los comerciantes.
- Marca los posibles puntos de reversión en el mercado.
- Puede mostrar tanto el principio como el final de la tendencia.
- Incluye todas las alertas de Metatrader.
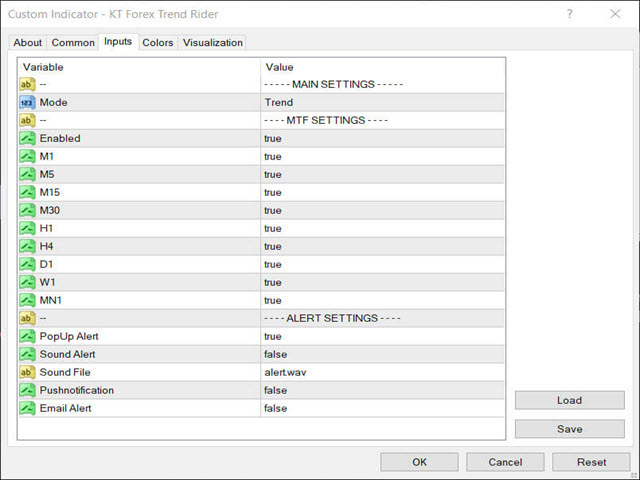
Entradas
- Modo: Scalper/Tick/Swing/Tendencia
- Configuración del escáner MTF
- Configuración de Alertas