Gann Square of 9 Levels
- Indikatoren
-
Aren Davidian
 Hello, I'm Aren Davidian, the founder and visionary behind ARKA, your go-to source for cutting-edge trading tools and expert insights. With over 14 years of experience in IT security within the Forex market, my journey into this captivating world began nearly four years ago.
 - Version: 2.0
- Aktivierungen: 5
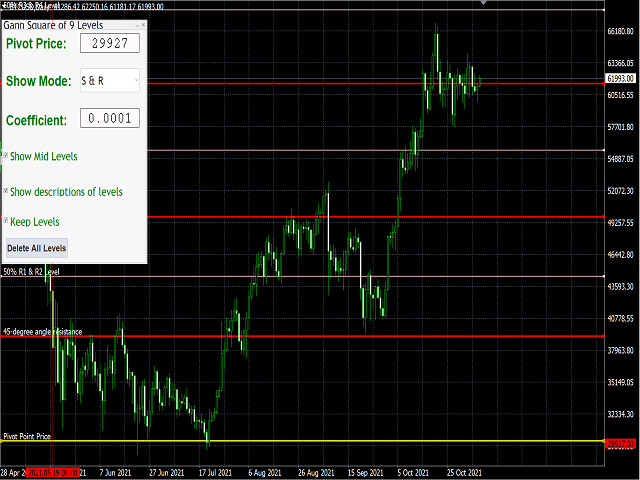
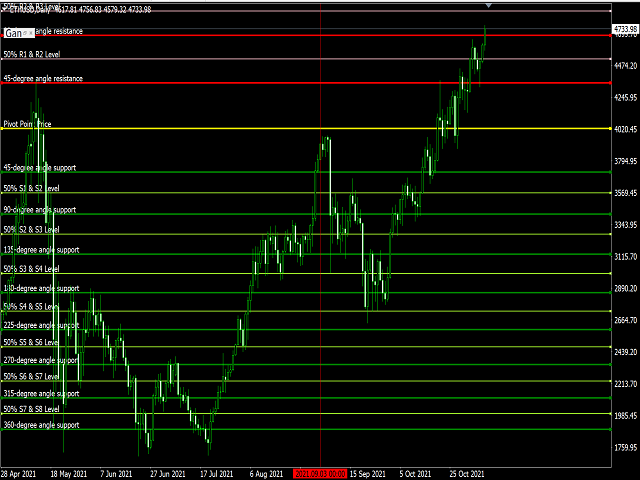
Dieser Indikator wurde auf der Grundlageder Neuner-Methode vonWDGannentwickelt.
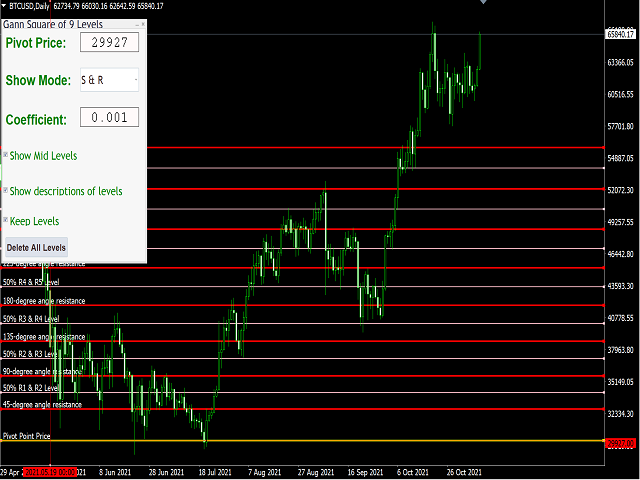
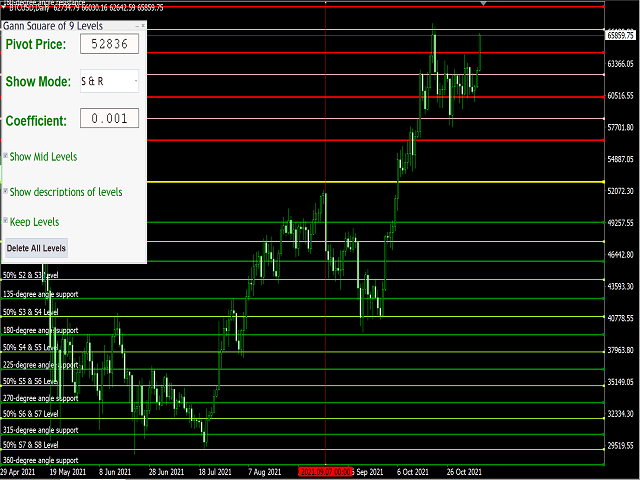
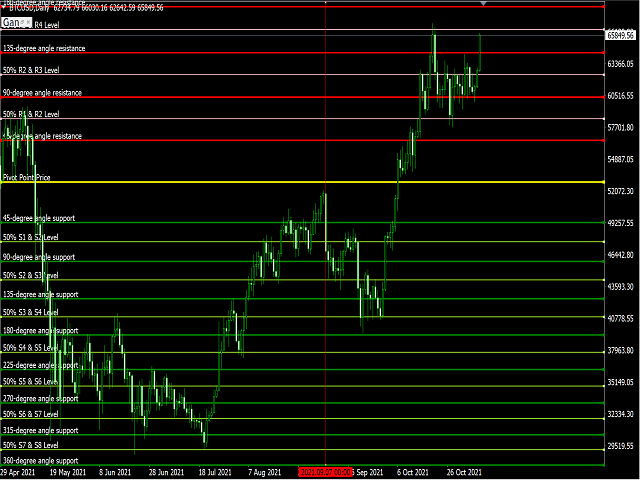
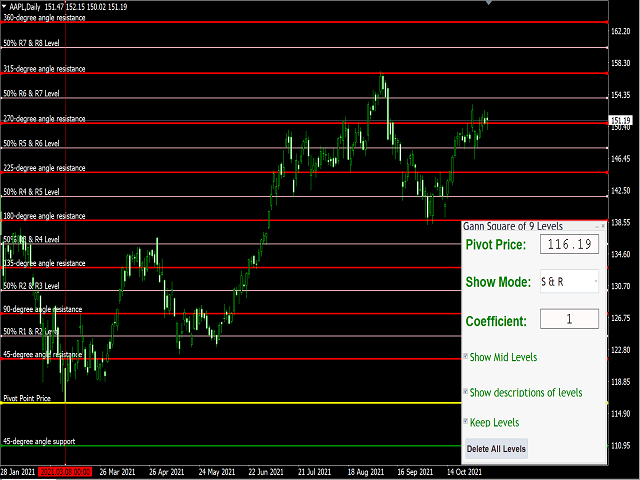
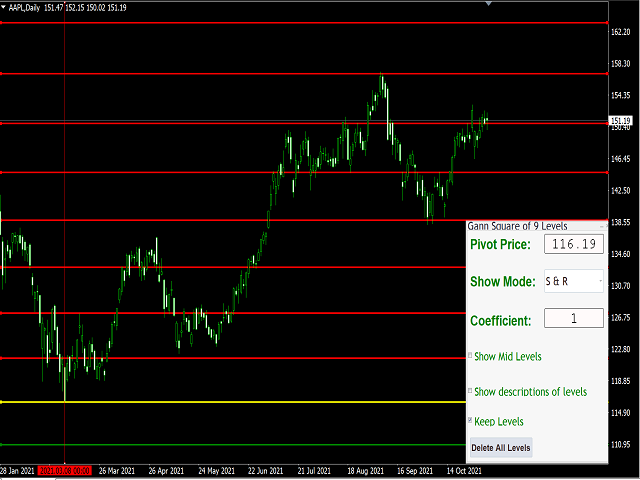
Mit diesem Indikator können wir den gewünschten Pivot-Preis eingebenund auf der Grundlage des Koeffizienten, den wir ihm zuweisen, 8Unterstützungs- und Widerstandszahlen mit 8 Winkeln von 45, 90, 135, 180, 225, 270, 315 und 360extrahieren.
Berechnet 8Unterstützungs- und Widerstandspunkte und zeichnetUnterstützungs- und Widerstandslinien .
Der Koeffizient soll die Anzahl der Ausführungen verdreifachen.
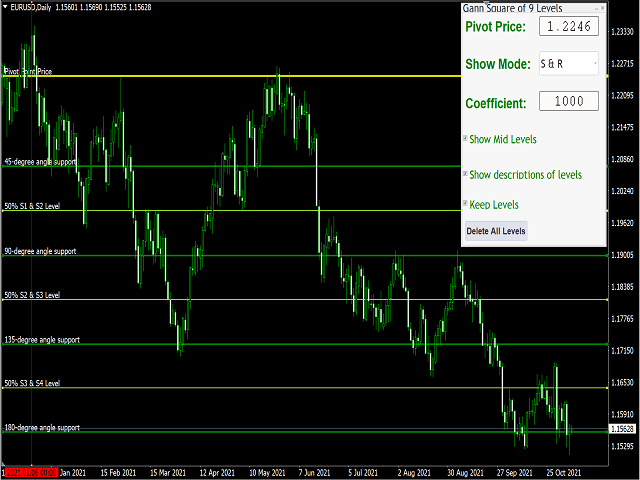
UmPivot-Punkteauszuwählen, bei denen ein Preis eine große Zahl ist, kann man durch die Wahl von Koeffizienten von 0,1, 0,01, 0,001 und 0.0001 können wirUnterstützungs- und Widerstandspunkte haben, die dem Zeitrahmen entsprechen.
Zum Beispiel kannder Preis vonBitcoin, der am 14. April 2021 64.854 betrug, verwendet werden, um dreistellige Berechnungen durchzuführen, indem ein Koeffizient von 0,0001 ausgewählt wird.
UmPivot-Punkte, deren Preis ist eine kleine Zahl, durch die Auswahl von Koeffizienten höher als 10, 100, 1000 und 10000, können wirUnterstützung und Widerstand Punkte , die für den Zeitrahmen.
Zum Beispiel der Preis von Dodge Münze, die 0,7399 am 8. Mai 2021 war, können wir dreistellige Berechnungen durch die Auswahl eines Koeffizienten von 100 Indikatoren durchzuführen.
Mit diesem Indikator können wir den gewünschten Pivot-Preis eingebenund auf der Grundlage des Koeffizienten, den wir ihm zuweisen, 8Unterstützungs- und Widerstandszahlen mit 8 Winkeln von 45, 90, 135, 180, 225, 270, 315 und 360extrahieren.
Berechnet 8Unterstützungs- und Widerstandspunkte und zeichnetUnterstützungs- und Widerstandslinien .
Der Koeffizient soll die Anzahl der Ausführungen verdreifachen.
UmPivot-Punkteauszuwählen, bei denen ein Preis eine große Zahl ist, kann man durch die Wahl von Koeffizienten von 0,1, 0,01, 0,001 und 0.0001 können wirUnterstützungs- und Widerstandspunkte haben, die dem Zeitrahmen entsprechen.
Zum Beispiel kannder Preis vonBitcoin, der am 14. April 2021 64.854 betrug, verwendet werden, um dreistellige Berechnungen durchzuführen, indem ein Koeffizient von 0,0001 ausgewählt wird.
UmPivot-Punkte, deren Preis ist eine kleine Zahl, durch die Auswahl von Koeffizienten höher als 10, 100, 1000 und 10000, können wirUnterstützung und Widerstand Punkte , die für den Zeitrahmen.
Zum Beispiel der Preis von Dodge Münze, die 0,7399 am 8. Mai 2021 war, können wir dreistellige Berechnungen durch die Auswahl eines Koeffizienten von 100 Indikatoren durchzuführen.