Robos
- Indikatoren
-
Namu Makwembo
 I am a Fx Trader and computer programmer , I make trading systems and indicators be sure to check out my hot collection
 - Version: 4.0
- Aktualisiert: 8 August 2022
- Aktivierungen: 11
Großes Angebot für die Robos, Holen Sie sich Ihre jetzt
Robos Indikator
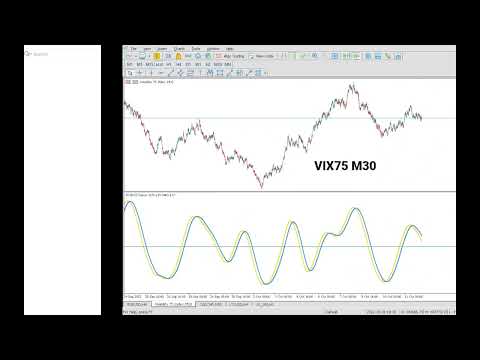
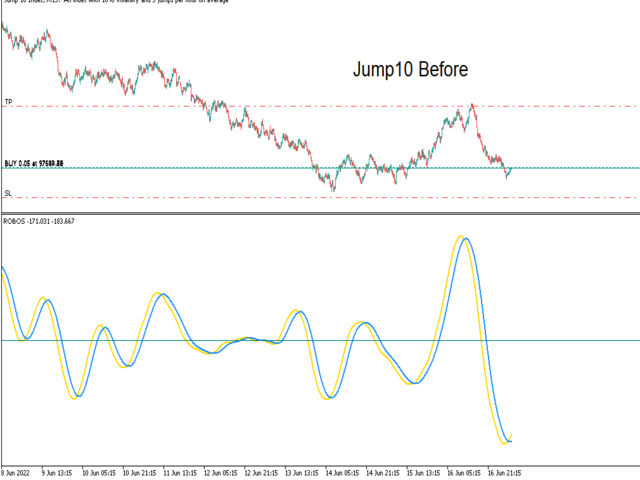
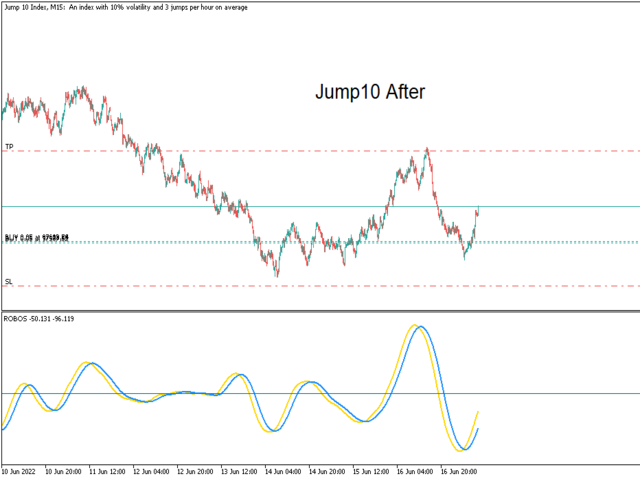
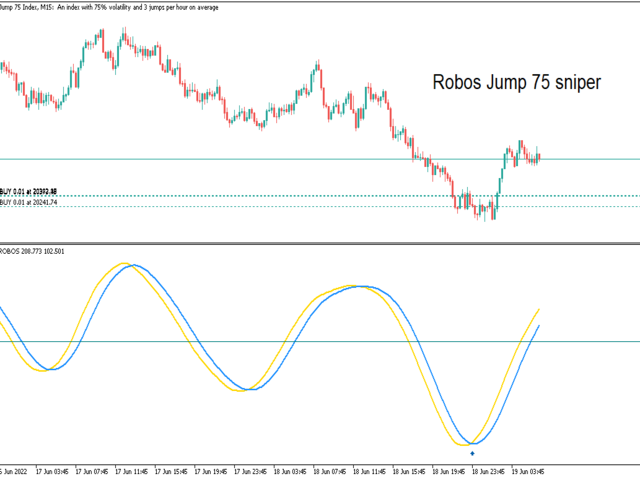
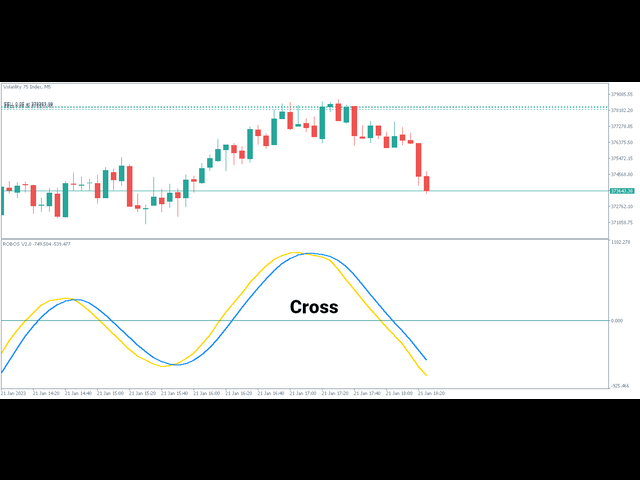
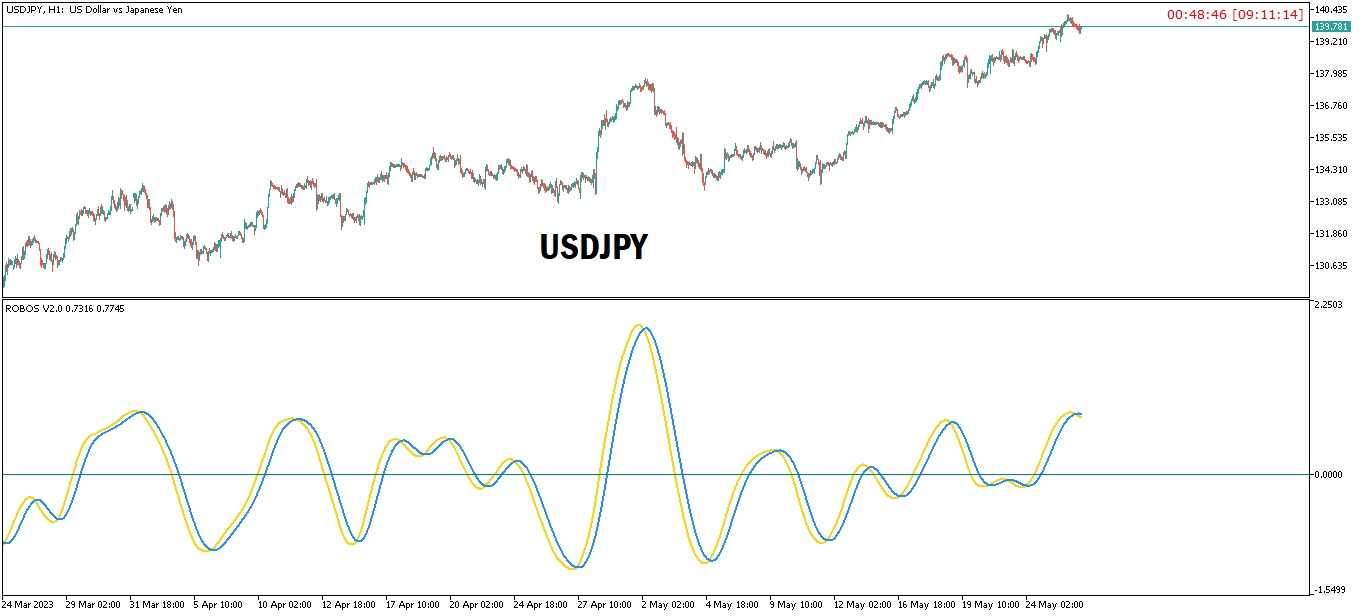
Der ROBOS-Indikator ist ein Multi-Zeitrahmen-Oszillator, der auf dieüberkauften und überverkauften Regionen eines Preisdiagramms abzielt. Ein Signal wird angezeigt, wenn sich die beiden Linien kreuzen, kompatibel mit allen handelbaren Instrumenten
Letzte Veröffentlichung
Das neueste Release ist die Version 4.0
#Was ist neu in Version 4.0?
Funktionen
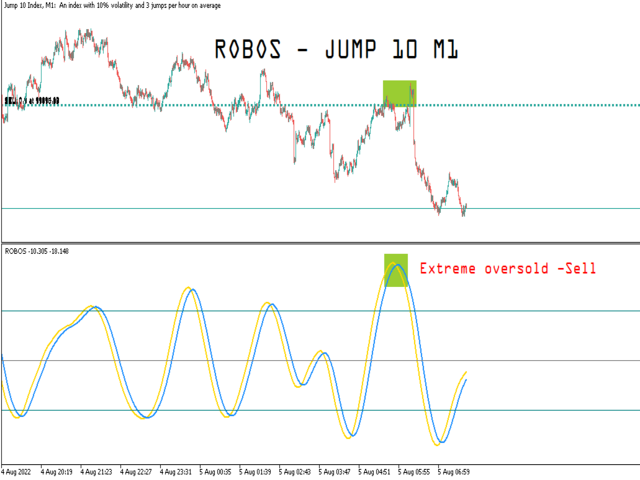
Extreme überverkaufte und überkaufte Niveaus
- ROBOS Version 4.0 kommt mit einer coolen neuen Funktion, der Möglichkeit, nur extrem überkaufte und überverkaufte Kurse anzuvisieren. Die neue Version gibt Ihnen auch die Möglichkeit, nur extrem überkaufte oder überverkaufte Signalwarnungen zuzulassen.
#Eingabeparameter
* Mode: Enum options ( 'Mix','swing catcher, 'mix')
* Look Back: 1000 ( die Grenze der zu berechnenden Kerzen )
___Alarm Optionen___
* Alarme aktivieren: Wahr/Falsch
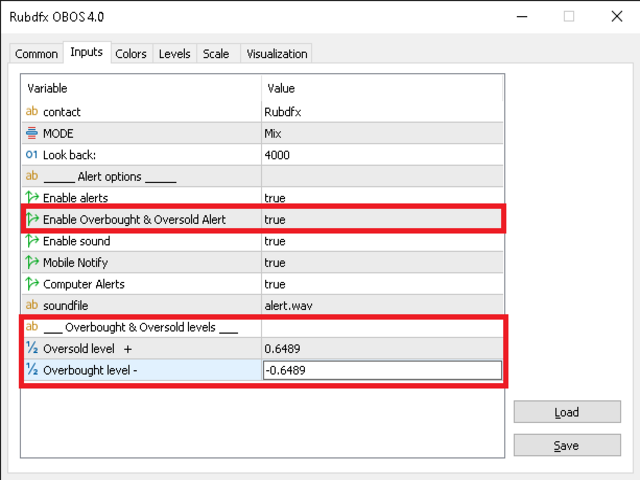
* Überkauft- und Überverkauft-Alarm aktivieren: Wahr /Falsch
* Ton aktivieren: Richtig/Falsch
* Mobile Benachrichtigung: Richtig/Falsch
* Computer-Warnungen: Richtig/Falsch
* Tondatei: alert.wav
Überkaufte & überverkaufte Levels___
* Überverkauftes Niveau + : Wert
* Überkaufte Level - : - Wert //negativer Wert
Beachten Sie, dass das überkaufte Niveau auf einen negativen Wert gesetzt werden sollte (fügen Sie ein negatives Zeichen " - " hinzu, bevor Sie den Wert des überkauften Niveaus hinzufügen).
-Dadurch wird der Indikator in die Lage versetzt, Benachrichtigungen zu senden, wenn der Kurs extrem überverkauft oder überkauft ist.
-Sie können die Benachrichtigungen über überkaufte und überverkaufte Kurse deaktivieren, indem Sie die Option "Overbought and Oversold Alerts" auf false setzen.
-Dies hat keinen Einfluss auf die normale Funktionalität des Indikators, alle anderen Alarme funktionieren auch ohne diese Funktion.
#IndikatorVerwendung?
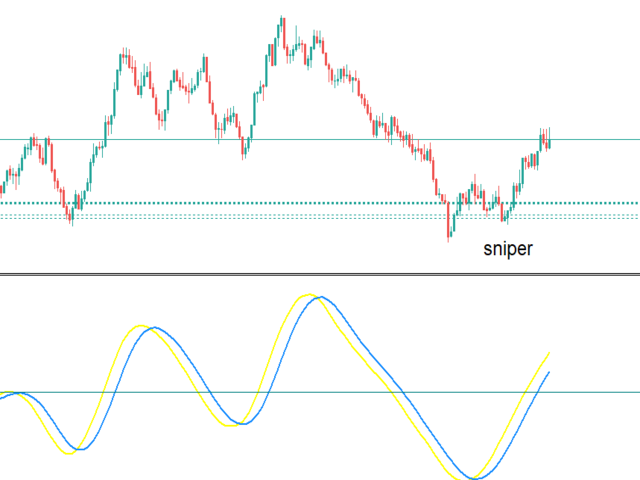
Kaufen: Platzieren Sie Ihre Buy Entries, wenn sich die Linien unterhalb der Null ( 0) Linie kreuzen, was ein Kaufsignal anzeigt, Sie können mit der neuen Version4.0 auch auf Signale aus überkauften Regionen abzielen; Stop Loss nur ein paar Pips unterhalb des Swing-Lows, eine gute Exit-Strategie wäre, wenn sich die Linien wieder kreuzen
Verkaufen: Platzieren Sie Ihre Verkaufseinträge, wenn sich die Linien oberhalb der Null(0 ) kreuzen , was ein Verkaufssignal anzeigt , Sie können mit der neuen Version4.0auch auf Signale aus überverkauften Regionen abzielen; Stop-Loss nur wenige Pips über dem Swing-Hoch, Gewinnmitnahme, wenn sich die Linien wieder kreuzen
Dieser Indikator funktioniert in der Regel auch gut, wenn er mit dem Price Tracker Indikator gepaart wird .
#Kompatibilität
-Alle handelbaren Währungspaare, synthetische Indizes, Metalle, Crypto, NASDAQ etsuitable für Scalping und Swing Trading,
-Es kann auch als zusätzliche Confluence verwendet werden, um einen Handel einzugehen, wenn der Preis auf einem signifikanten Niveau von Angebot und Nachfrage ist oder die Trendlinie berührt
-MT4/MT5 Versionen verfügbar, kontaktieren Sie uns
Um detaillierte Informationen über die Verwendung von überkauften und überverkauften Levels zu erhalten, lesen Sie bitte hier weiter

RESPECT TO THE AUTHOR