Moving Average Force
- Indikatoren
- Version: 1.0

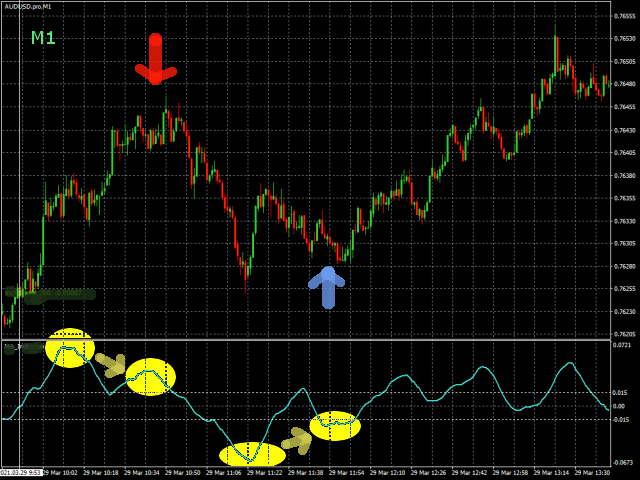
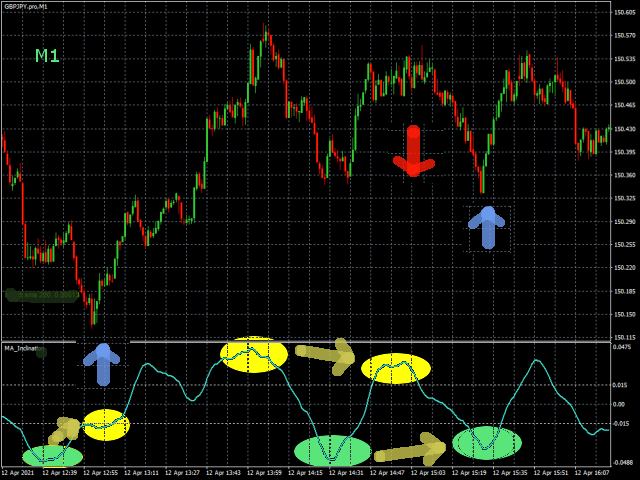
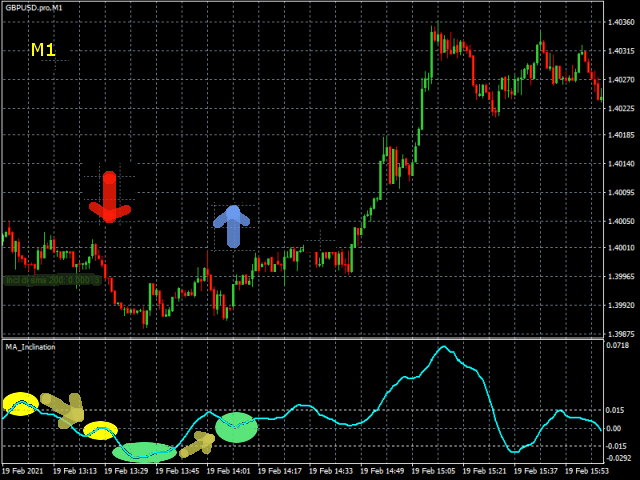
Scalp mit dem Verhalten eines kurzen gleitenden Durchschnitts, gibt der Indikator die Steigung und identifiziert die "hyper" Momente.
Operative Ratschläge:
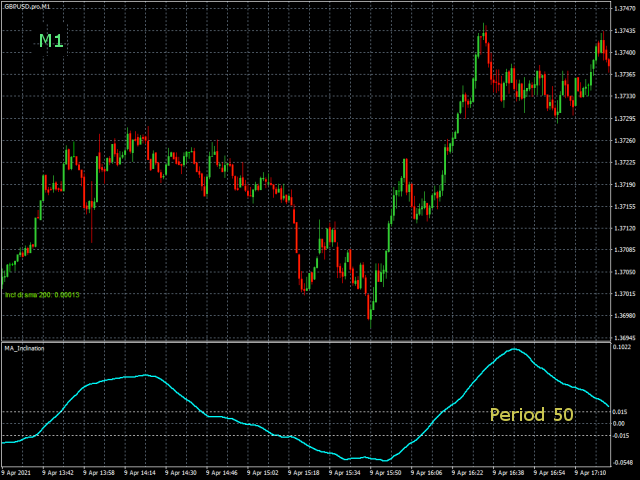
M1-Chart verwenden.
Periode 20: Kaufen Sie nach zwei steigenden Tiefs; verkaufen Sie nach zwei maximalen Abwärtsbewegungen; vermeiden Sie gegenläufige Eröffnungen; wenn die Linie flach wird, setzen Sie einen Stopp beim Eröffnungskurs. Vermeiden Sie Aktionen in Zeitfenstern mit geringer Volatilität.
Wenn die Kurve, die das Minimum / Maximum zeichnet, sehr flach ist, ist es besser, mindestens 15' zu verschieben.
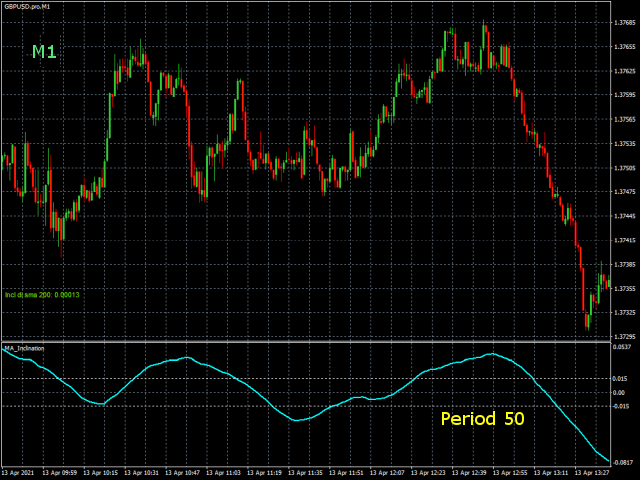
Periode 50: Passt sich dem Trend an, wenn sie sich an den Extremen befindet, zeigt sie deutlich an, wann der Trend beginnt und endet.
Um den Periodenindikator zu ändern, klicken Sie mit der rechten Maustaste auf die Linie und wählen Sie die Eigenschaft "MA-Neigung ()". Sie können auch die Linienfarbe und andere Eigenschaften anpassen.
Empfohlene Paare: EurUsd, GbpUsd, UsdJpy, AudUsd, NzdUsd, GbpJpy, GbpAud, GbpCzk, GbpHuf, GbpNzd, UsdSgd, ...


This indicator is really useful, I think you did an excellent job, I would like to have more details about how you calculate the strength of the moving average and normalize the data. Este indicador es realmente util, creo que hiciste un excelente trabajo, me gustaria tener mas detalles sobre como calculas la fuerza de la media movil y normalizar los datos.