AdaptiveRSiMt5
- Indikatoren
- Version: 1.1
- Aktualisiert: 17 Juli 2020

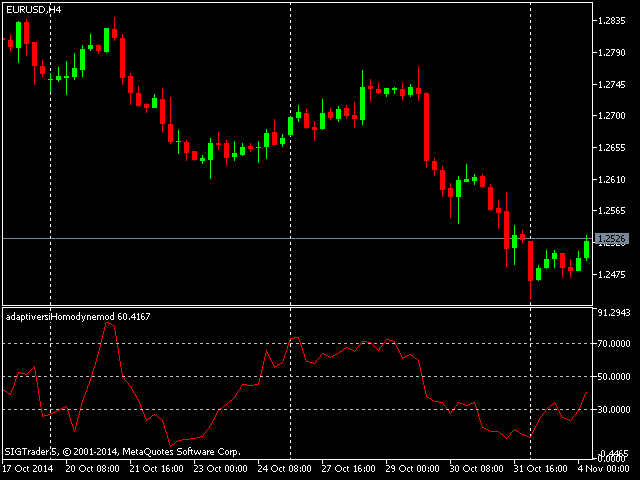
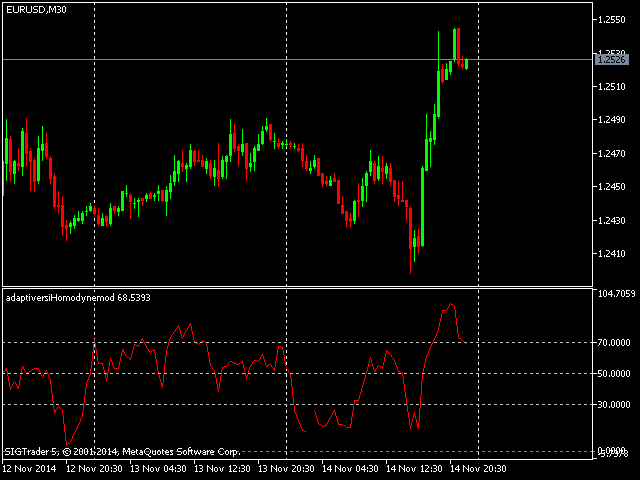
Der Relative-Stärke-Index ist ein Oszillator, der den Kursen folgt. Er wurde von Welles Wilder eingeführt, der später den 14-Perioden-RSI empfahl. Diese adaptive Version basiert auf dem Indikator, der von John Ehlers in seinem Buch "Rocket Science for Traders" beschrieben wurde. Der Indikator verwendet den Homodyne-Descriminator, um den dominanten Zyklus zu berechnen.
Um den Homodyn-Deskriminator anzuwenden, müssen Real- und Imaginärteil aus den Inphase- und Quadraturkomponenten berechnet werden. (Die Inphase- und Quadraturkomponenten werden mithilfe der Hilbert-Transformation abgeleitet. Um mehr darüber zu erfahren, lesen Sie den Artikel über Theorie und Implementierung fortgeschrittener adaptiver Indikatoren. Die Abschnitte über Komplexe Zahlen und Phasoren zur Messung von Marktzyklen und auch Messung der Zyklusdauer). Um dies zu erreichen, wird das Produkt aus der aktuellen Inphase-Komponente und ihrem Wert vor einem Takt zu dem Produkt aus der aktuellen Quadratur-Komponente und ihrem Wert vor einem Takt addiert, um den Realteil zu erhalten. Für den Imaginärteil wird das Produkt aus der aktuellen Quadraturkomponente und dem Wert der Inphase-Komponente vor einem Takt von dem Produkt aus der aktuellen Inphase-Komponente und dem Wert der Quadratur-Komponente vor einem Takt abgezogen. Real- und Imaginärteil werden dann geglättet, bevor die Zyklusperiode abgeleitet werden kann.
Der Zyklus wird berechnet, indem man den Arkustangens des Imaginärteils durch den Realteil teilt. Es werden Einschränkungen gemacht, um sicherzustellen, dass die Änderungsrate der Zyklusperiode auf +-50% der vorherigen Zyklusperiode begrenzt ist und dass die resultierende Zyklusperiode größer als 6 und kleiner als 50 ist. Die Glättung wird dann zum letzten Mal auf die Zyklusperiode angewendet.
Dieser Wert der Zyklusperiode wird dann bei jedem Balkenschluss als Wert verwendet, der die Anzahl der zurückliegenden Balken darstellt, die für die Erstellung des Indikators für die relative Stärke analysiert werden. Dies ermöglicht den adaptiven Charakter des Indikators.
Er kann als Alternative zum herkömmlichen Relative-Stärke-Index verwendet werden. Sie müssen sich nicht um die Einstellung von Zeiträumen kümmern.
Parameter des Indikators:
- Der Grenzwert steuert die Anzahl der Balken, für die der Indikator gezeichnet wird.
- Der Zyklusteil ist ein Modifikator für die berechnete Zyklusperiode, der dazu beiträgt, dass der Indikator mit den Kursdaten in Phase bleibt. Die Zahl kann auch verwendet werden, um den Indikator für den gemessenen Zyklus zu optimieren.


для меня слишком заумно . Да и перерисовывается скорее .Правда не проверял