Multi Pivot Unlimited
- Indicadores
- Versión: 2.0
- Actualizado: 16 abril 2021
- Activaciones: 5

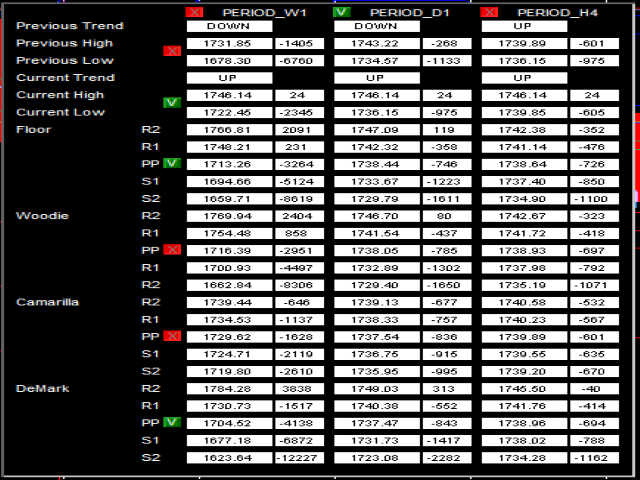
Cinco tipos (Floor, Woodie, Camarilla, DeMark, & Fibonacci) de popularesPuntos Pivote para determinar los niveles de Resistencia y Soporte.
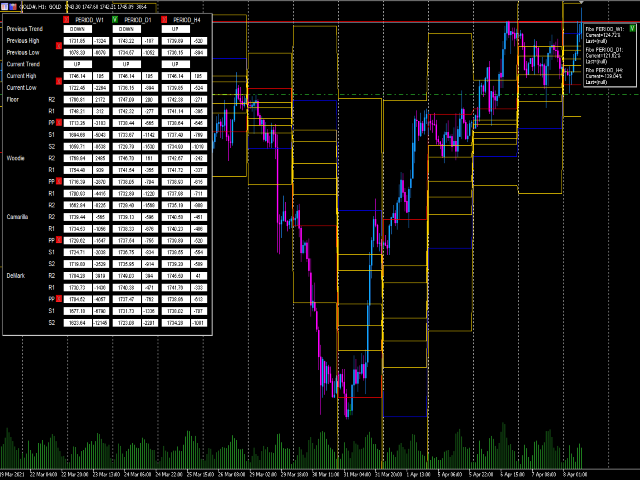
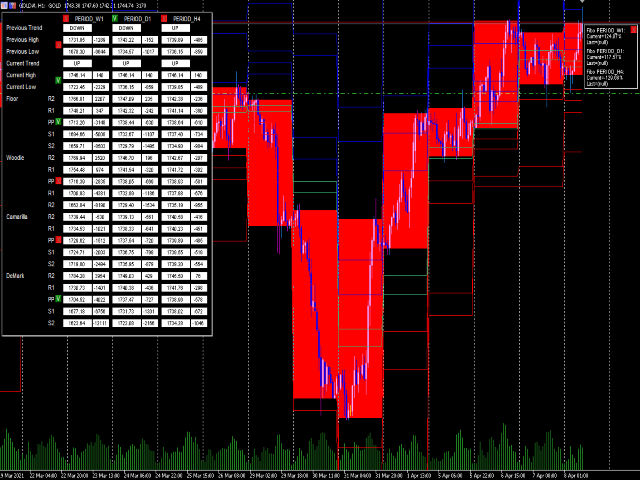
Con solo usar un simple botón en el gráfico, puede mostrar algunos o todos los tipos dePuntos Pivote, niveles de Resistencia y Soporte como desee.
Puede utilizarlo paratodos los pares de divisas,criptomonedas yacciones sin restricciones.
Línea de señalpara facilitar la lectura del patrón de precio de cierre alto-bajo. (Normalmente uso 15M timeframes para el gráfico y 1Day para el indicador)
Recibe unaNotificación cuando el precio cruza la líneaArriba o Abajo.
Esta es la versión gratuita: https://www.mql5.com/en/market/product/65132
Para trabajar con Timeframes seleccionados, por favor actualice la historia de los Timeframes seleccionando los periodos (M5, M15, M30, H1, etc.) primero. (Habrá una futura actualización para esto, para que pueda actualizar automáticamente el historial)
Si hay algún otro problema, puede enviarme un mensaje.
Utilidad de Gráficos:
- Botones para mostrar la línea Pivot en el Gráfico (Puede mostrar múltiples líneas pivot)
- Botones para elegir el Timeframe de la línea Pivot en el Gráfico
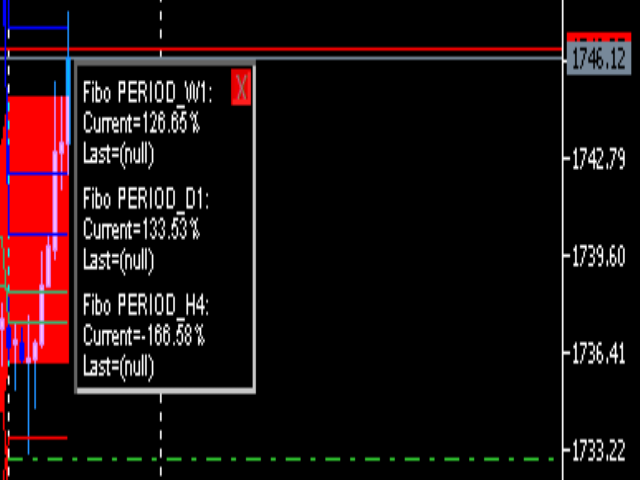
- Mini panel de Fibonacci para mostrar el detalle de la posición porcentual actual
- Precio de cada Pivot y Timeframes (puede copiar el valor y pegarlo para hacer una orden )
- Puntos Gaps del precio del Pivote y el precio Actual (puede copiar el valor y pegarlo para realizar una orden)
Entradas:
- Periodo 1 timeframes
- Periodo 2 timeframes
- Periodo 3 timeframes
- Fibonacci Más100, Antes100 , AntesAntes100, Medio, DespuésDeCero, DespuésDeCero y MenosDeCero Porcentaje de nivel
- Alerta (Activar notificación de alerta)
- Correo electrónico (Habilitar notificación por correo electrónico)
- MetaQuotes (Habilite la notificación de MetaQuotes, puede recibir una notificación desde un dispositivo móvil)
- Activar notificación de Periodo 1, Periodo 2 y Periodo 3
- Habilitar notificaciones de Floor, Woodie, Camarilla, DeMark y Fibonacci
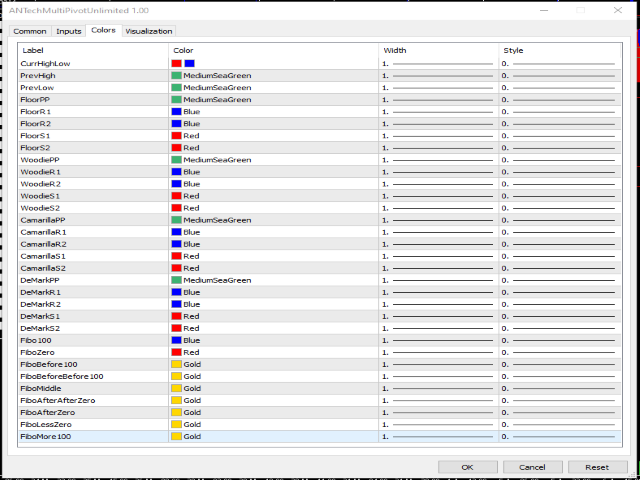
- Línea de color y tipo para cada pivote