Volume Zone Range MT4
- Indikatoren
- Version: 1.0
- Aktivierungen: 5

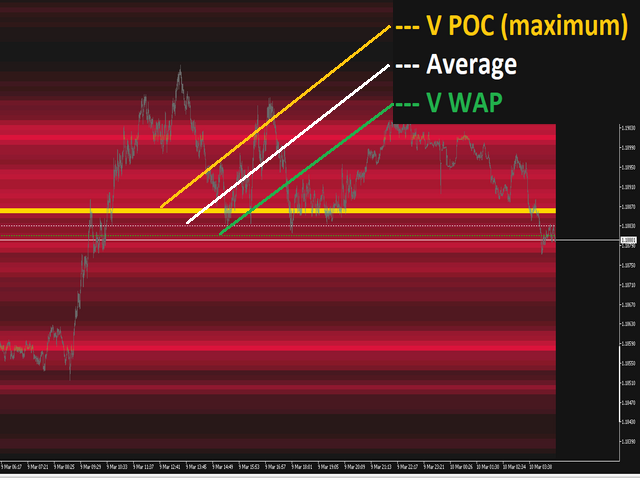
Dieser Indikator zeigt die Zone mit hohem Volumen an. Ab den letzten Minuten, die Sie selbst festlegen, wird das Bild der Volumenzone laufend generiert.
Der Indikator zeigt auch die Linien V-Poc, Durchschnittsvolumen und V-WAP an.
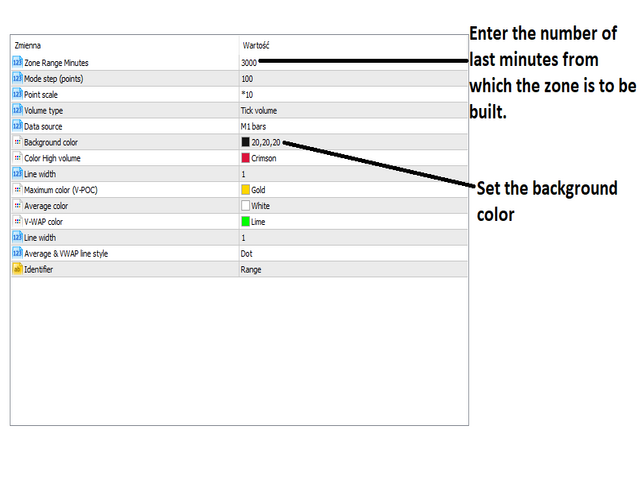
Wenn Sie hohe Intervalle verwenden, müssen Sie eine große Anzahl von Minuten eingeben.
Die Zone baut sich selbst auf, wenn sich der Chart bewegt.
Wenn Sie eine Zone aufbauen wollen von:
letzter Tag - 1440 Minuten,
letzte Woche - 10080 Minuten,
... usw.
Wenn Sie einen Indikator benötigen, der die konstanten Zeitrahmen der Volumenzone anzeigt, finden Sie ihn ...HIER...
Volume Zone ist eine fortschrittliche Charting-Studie, die die Handelsaktivität über einen bestimmten Zeitraum zu bestimmten Kursniveaus anzeigt. Die Studie (unter Berücksichtigung der vom Benutzer definierten Parameter wie Anzahl der Zeilen und Zeitraum) zeichnet ein Histogramm auf dem Chart, das dominante und/oder signifikante Kursniveaus basierend auf dem Volumen aufzeigen soll. Im Wesentlichen nimmt Volume Zone das Gesamtvolumen, das zu einem bestimmten Preisniveau während des angegebenen Zeitraums gehandelt wurde, und teilt das Gesamtvolumen entweder in Kauf- oder Verkaufsvolumen auf und macht diese Information dann für den Händler leicht sichtbar.
Unterstützungs- und Widerstandsniveaus
Die meisten Händler verwenden die Volumenzone in erster Linie, um grundlegende Unterstützungs- und Widerstandsniveaus zu ermitteln. Es ist wichtig zu beachten, dass die Verwendung von Volume Zone als Identifikator für Unterstützungs- und Widerstandsniveaus eine reaktive Methode ist. Das bedeutet, dass im Gegensatz zu proaktiven Methoden (wie Trendlinien und gleitende Durchschnitte), die auf aktuellen Kursbewegungen und Analysen zur Vorhersage zukünftiger Kursbewegungen beruhen, reaktive Methoden auf vergangenen Kursbewegungen und dem Volumenverhalten basieren. Reaktive Methoden können nützlich sein, wenn es darum geht, Preisniveaus, die der Markt bereits besucht hat, eine Bedeutung zu verleihen. Die grundlegende technische Analyse hat gezeigt, dass ein Unterstützungsniveau ein Preisniveau ist, das einen Preis auf seinem Weg nach unten unterstützt, und ein Widerstandsniveau ein Preisniveau ist, das einem Preis auf seinem Weg nach oben Widerstand entgegensetzt. Daraus kann man schließen, dass ein Preisniveau in der Nähe der Unterseite der Zone, das in Bezug auf das Volumen die Kaufseite stark begünstigt, ein guter Hinweis auf ein Unterstützungsniveau ist. Das Gegenteil ist ebenfalls der Fall. Ein Kursniveau nahe dem oberen Ende der Zone, bei dem das Volumen auf der Verkaufsseite stark überwiegt, ist ein gutes Indiz für ein Widerstandsniveau.