VSAs Volume Channel
- Indikatoren
- Version: 1.0
- Aktivierungen: 5

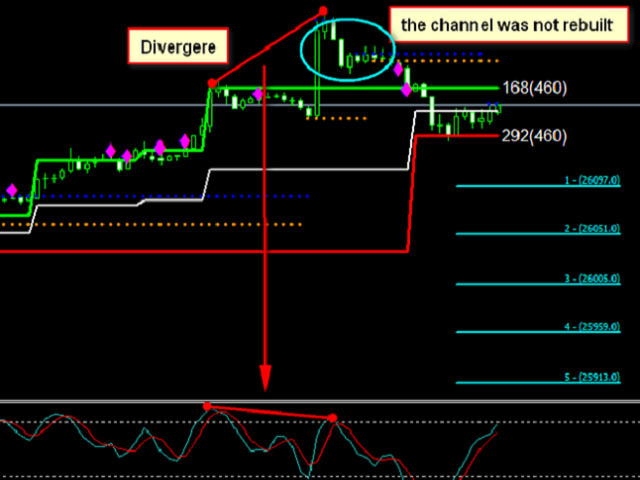
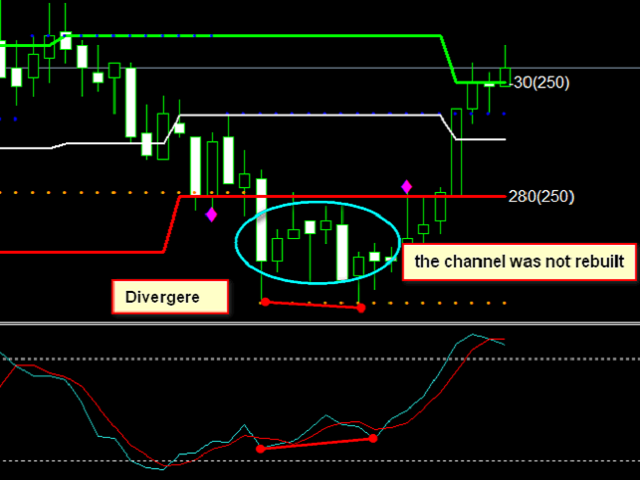
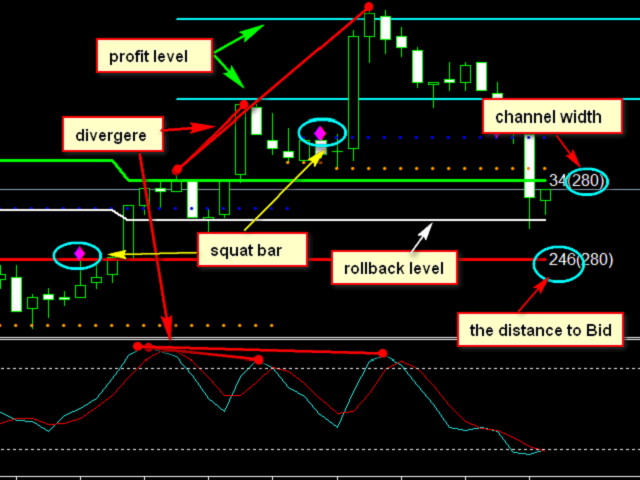
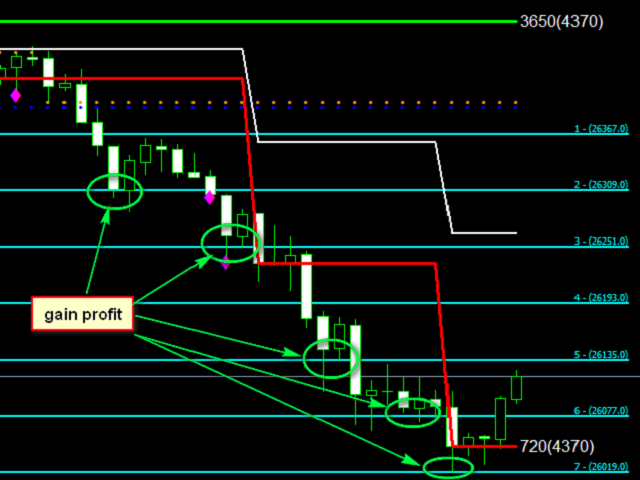
Der Indikator wird durch einen komplexen Algorithmus des Autors berechnet. Er wird unter Berücksichtigung des Trends durch überkaufte und überverkaufte Volumenzonen erstellt. Er ermöglicht es, Divergenzen der Volumina zu erkennen und die sogenannten Squat Bars zu identifizieren. Er definiert auch Markteintrittsniveaus und Ziele. Die Mittellinie des Kanals ist das erwartete Pullback-Niveau.
RPeriod - Berechnungszeitraum des Indikators
Indicator_Level - Niveau der überkauften und überverkauften Zonen
Draw Fibo Levels - Anzeige der Zielniveaus
Fibo Level Color - Farbe der Zielniveaus
Arrow Price Color - Farbe der Beschriftung der Kanalbreite und des Abstands zu den Grenzen
CountBars - Anzahl der berechneten Bars.