Buy Sell Zones 2
- Indikatoren
- Version: 2.2
- Aktualisiert: 27 Juni 2020
- Aktivierungen: 5

Kaufen-Verkaufen-Zonen
Einfacher Indikator für bewegliche BUY / Sell Zonen und Buy / Sell Signale, die mit dem Indikator generiert werden
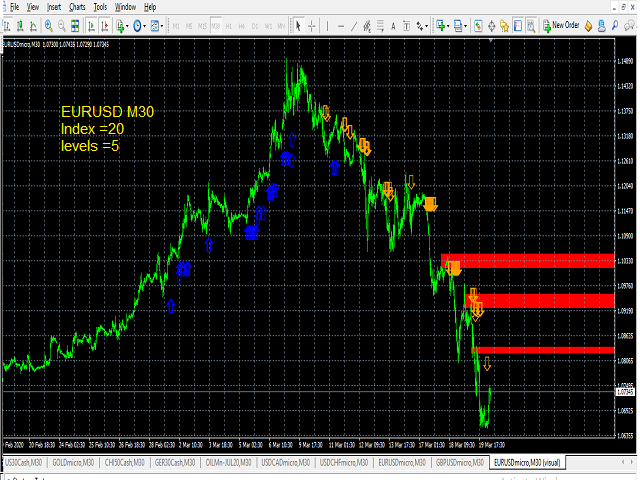
bewegte Kauf- und Verkaufszonen : Die engste Zone ist breit und klar : Rot für die Verkaufszone, Grün für die Kaufzone >>> alte Fernzonen sind in fetten Linien
:::BUY Zones (GRÜN) erscheinen nur im UP Trend und verschwinden im DOWN Trend
:::SELL-Zonen (ROT) erscheinen nur im DOWN-Trend und verschwinden im UP-Trend
Eingabeparameter :::
Indexbalken : Balkenbereich für die Zonenberechnung
Levels : Anzahl der Zonen
Pfeile für Aufwärtsbewegung/Abwärtsbewegung
Mail und Nachricht Alerts !!
auf jedes Symbol anwendbar
für einen beliebigen Zeitrahmen
Beispiel für M30 EURUSD mit Index = 20 und Levels =5