Key Volumes MT5
- Indikatoren
-
Pavel Verveyko
 Writing scripts, indicators, EAs on MQL5 and MQL4.
Fast, Reliable, And High-Quality.
For all questions, please contact personal messages. - Version: 1.2
- Aktualisiert: 27 November 2020
- Aktivierungen: 5
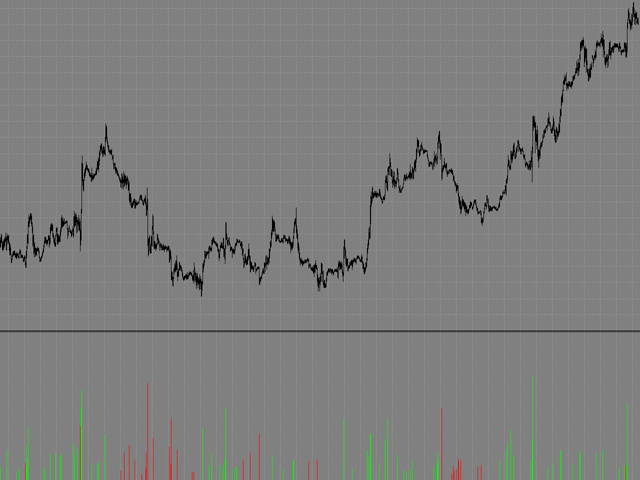
Der Indikator zeigt die wichtigsten Volumina an, die durch die Preisbewegung bestätigt werden.
Der Indikator ermöglicht es Ihnen, die Volumina in Richtung, Häufigkeit und Wert zu analysieren.
Es gibt 2 Betriebsmodi: Berücksichtigung des Trends und Nichtberücksichtigung des Trends (wenn der Parameter Period_Trend = 0 ist, wird der Trend nicht berücksichtigt; wenn der Parameter Period_Trend größer als Null ist, wird der Trend in den Volumina berücksichtigt).
Der Indikator wird nicht neu gezeichnet.
Einstellungen
- History_Size - die Menge der Historie für die Berechnung.
- Period_Candle - Volatilitätsperiode.
- Mult_RS - Volatilitätsverhältnis.
- Period_Trend - Trendperiode (wenn Period_Trend = 0, wird der Trend ignoriert)
- Send_Sound - Tonalarm.
- Send_Mail - eine E-Mail-Benachrichtigung senden.
- Send_Notification - sendet eine mobile Benachrichtigung.
- Send_Alert - Standard-Terminal-Alarm.