Running along Lines MT5
- Indicadores
-
Pavel Verveyko
 Writing scripts, indicators, EAs on MQL5 and MQL4.
Fast, Reliable, And High-Quality.
For all questions, please contact personal messages. - Versão: 1.3
- Atualizado: 27 novembro 2020
- Ativações: 5
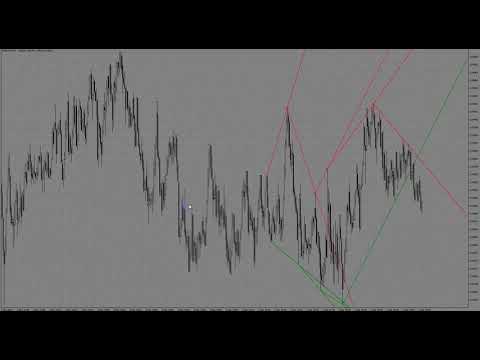
The indicator draws support and resistance lines on an important part of the chart for making decisions.
After the trend line appears, you can trade for a breakout or rebound from it, as well as place orders near it.
Outdated trend lines are deleted automatically. Thus, we always deal with the most up-to-date lines.
The indicator is not redrawn.
Settings:
- Size_History - the size of the calculated history.
- Num_Candles_extremum - the number of candles on each side of the extremum.
- Type_Arrows_extremum - label style.
- Color_Line_High - color of resistance lines.
- Color_Line_Low - color of support lines.
- Style_Line - line style.
- Width_Line - line width.
- Send_Sound - sound alert.
- Send_Mail - send an email notification.
- Send_Notification - send a mobile notification.
- Send_Alert - standard terminal alert.

Fantastic product that draws Trendlines as the market develops. Also like the dots that locate the supports and resistance. The developer also responds very fast any queries.