Trailing Uses Quadratic Regression
- Indikatoren
- Version: 1.0
- Aktivierungen: 5
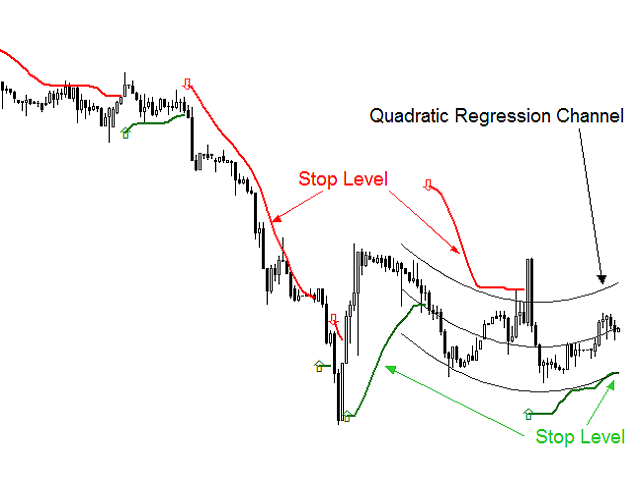
- Dabei handelt es sich um einen Indikator für eine Richtungsbewegung, der es Ihnen ermöglicht, den Trend zum Zeitpunkt seines Beginns zu bestimmen und die Höhe eines schützenden Stopps festzulegen.
Das Trailing kann sowohl von unten erfolgen, wenn das Stopp-Niveau unter dem aktuellen Kurs liegt und bei einem Anstieg des Kurses nach oben gezogen wird, als auch von oben, wenn die Stopp-Niveaus über dem aktuellen Kurs liegen.
Im Gegensatz zum Trailing mit konstantem Abstand wird das Stopp-Level an der unteren Grenze des quadratischen Regressionskanals gesetzt (beim Trailing von unten). Beim Trailing von oben befindet sich der Stopp an der oberen Grenze des Kanals.
Eine Änderung der Trailing-Richtung tritt ein, wenn das Stop-Level den Schlusskurs des Balkens kreuzt.
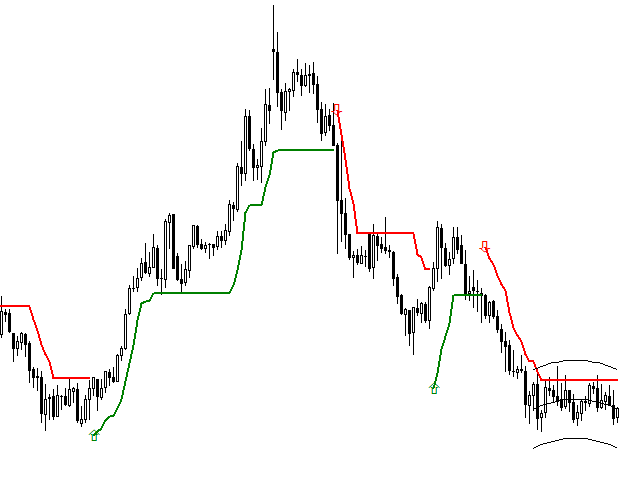
Die Momente des Trendwechsels sind durch Pfeile gekennzeichnet.
Vorteile
Stabile Trenderkennung vom Beginn bis zum Ende.
Er ist leicht zu erkennen und zu interpretieren.
Funktioniert bei jedem Instrument.
Funktioniert auf allen Zeitskalen.
Nicht neu gezeichnet, nicht nachgezählt.
Optionen
Regressionsperiode - Periode der quadratischen Regression
Multiplikator - Koeffizient zur Festlegung der Kanalbreite
Die Grenzen des Kanals sind von seiner Mitte durch den Wert Multiplikator * Sigma getrennt, wobei Sigma die Standardabweichung der Schlusskurse von der Regressionslinie ist.
Verwendung
Der Indikator kann auf mehrere Arten verwendet werden.
Als Zeichen für einen Trend.
Zur Beurteilung der Stärke des Trends: Wenn der Kurs die Indikatorlinie deutlich überschreitet, gewinnt ein wachsender Trend an Stärke. Nähert sich der Kurs der Indikatorlinie, so schwächt sich der Aufwärtstrend ab. Ein fallender Trend wird ebenfalls erkannt.
Kauf-/Verkaufssignale zu generieren, wenn der Kurs die Indikatorlinie kreuzt.
Merkmale
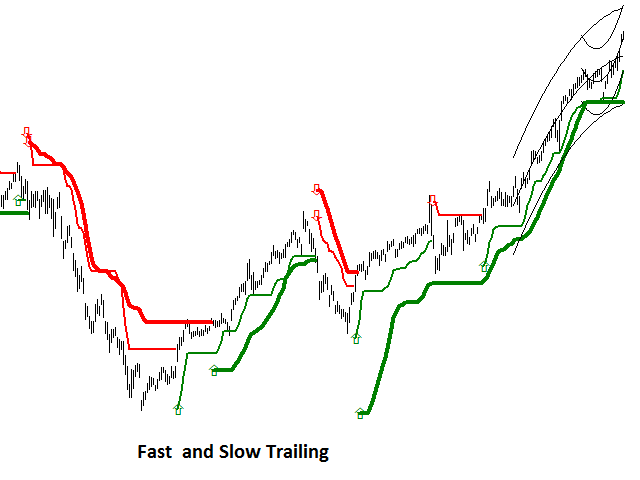
Je länger die Regressionsperiode, desto seltener signalisiert der Indikator einen Trendwechsel