Adaptive Trailing Uses RSI Indicator
- Indikatoren
- Version: 1.0
- Aktivierungen: 5
Adaptive Trailing verwendet den RSI-Indikator - einen Indikator für die Richtungsbewegung, der es Ihnen ermöglicht, den Trend zum Zeitpunkt seines Beginns zu bestimmen und die Höhe eines schützenden Stopps festzulegen.
Das Trailing kann sowohl von unten erfolgen, wenn das Stopp-Niveau unter dem aktuellen Kurs liegt und bei einem Anstieg des Kurses nach oben gezogen wird, als auch von oben, wenn die Stopp-Niveaus über dem aktuellen Kurs liegen.
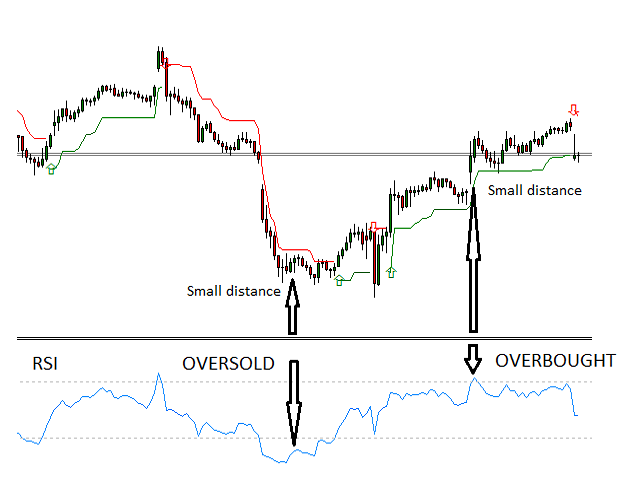
Es gibt zwei Modi für die Berechnung des Stop-Levels. Das einfache Trailing erfolgt mit einem konstanten Abstand von N Punkten zum aktuellen Kurs. Beim adaptiven Trailing werden die Messwerte des rsi-Indikators berücksichtigt. Wenn der Trailing-Modus von unten eingestellt ist, wird der Abstand bei rsi-Werten über 50 verringert; der Abstandsverringerungskoeffizient wird berechnet als K = (100 - rsi) / 50. Wenn der Nachlaufmodus von oben eingestellt ist, wird der Abstand bei rsi-Werten unter 50 verringert, der Abstandsreduzierungskoeffizient wird berechnet als K = rsi / 50.
Beispiel. Der adaptive Nachlaufmodus ist von unten eingestellt, der konstante Abstand beträgt 100 Punkte, der Wert rsi = 75. Abstandsreduzierungskoeffizient K = (100-75) /50=0,5. Der Abstand zum Kurs beträgt 100 * 0,5 = 50 Punkte.
Somit passt sich die Trailing-Methode der Preisvolatilität an.
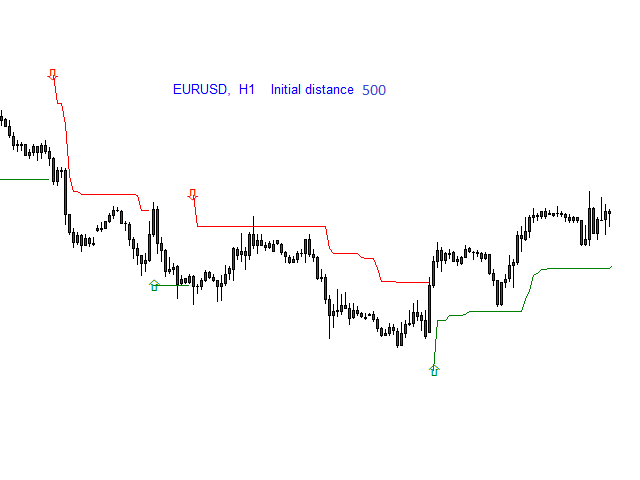
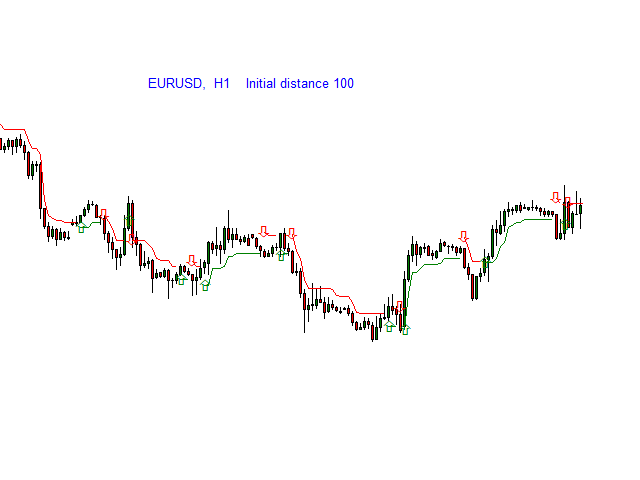
Die Momente des Trendwechsels sind durch Pfeile gekennzeichnet.
Vorteile
- Stabile Trenderkennung vom Beginn bis zum Ende.
- Er ist leicht wahrzunehmen und zu interpretieren.
- Funktioniert bei jedem Instrument.
- Funktioniert in allen Zeitrahmen.
- Nicht neu gezeichnet, nicht nachgezählt.
Eingaben
- Initial Trailing Distance (Punkte) - der anfängliche Abstand zum Preis, der gespeichert wird, wenn der adaptive Modus nicht verwendet wird
- RSI-Periode - Periode des RSI-Indikators
- Is_Adaptive_Mode - Flagge zur Aktivierung des adaptiven Modus
- Shift - Verschiebung des Indikators, Anzahl der Balken.
Verwendung von
Der Adaptive Trailing verwendet RSI-Indikator kann auf verschiedene Weise verwendet werden.
Als Zeichen für einen Trend.
Zur Beurteilung der Stärke des Trends: Wenn der Kurs die Indikatorlinie deutlich überschreitet, gewinnt ein steigender Trend an Stärke. Nähert sich der Kurs der Indikatorlinie, dann schwächt sich der Aufwärtstrend ab. Ein fallender Trend wird ebenfalls erkannt.
Um Kauf-/Verkaufssignale zu generieren, wenn der Kurs die Indikatorlinie kreuzt.
Merkmale
Je länger der Berechnungszeitraum des RSI-Indikators ist, desto seltener signalisiert der Indikator einen Trendwechsel.