Candle Pattern Alert
- Indikatoren
- Version: 1.12
- Aktualisiert: 22 April 2025
- Aktivierungen: 5

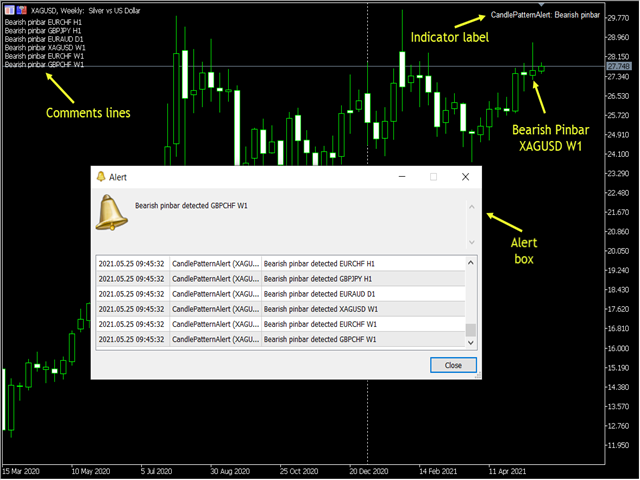
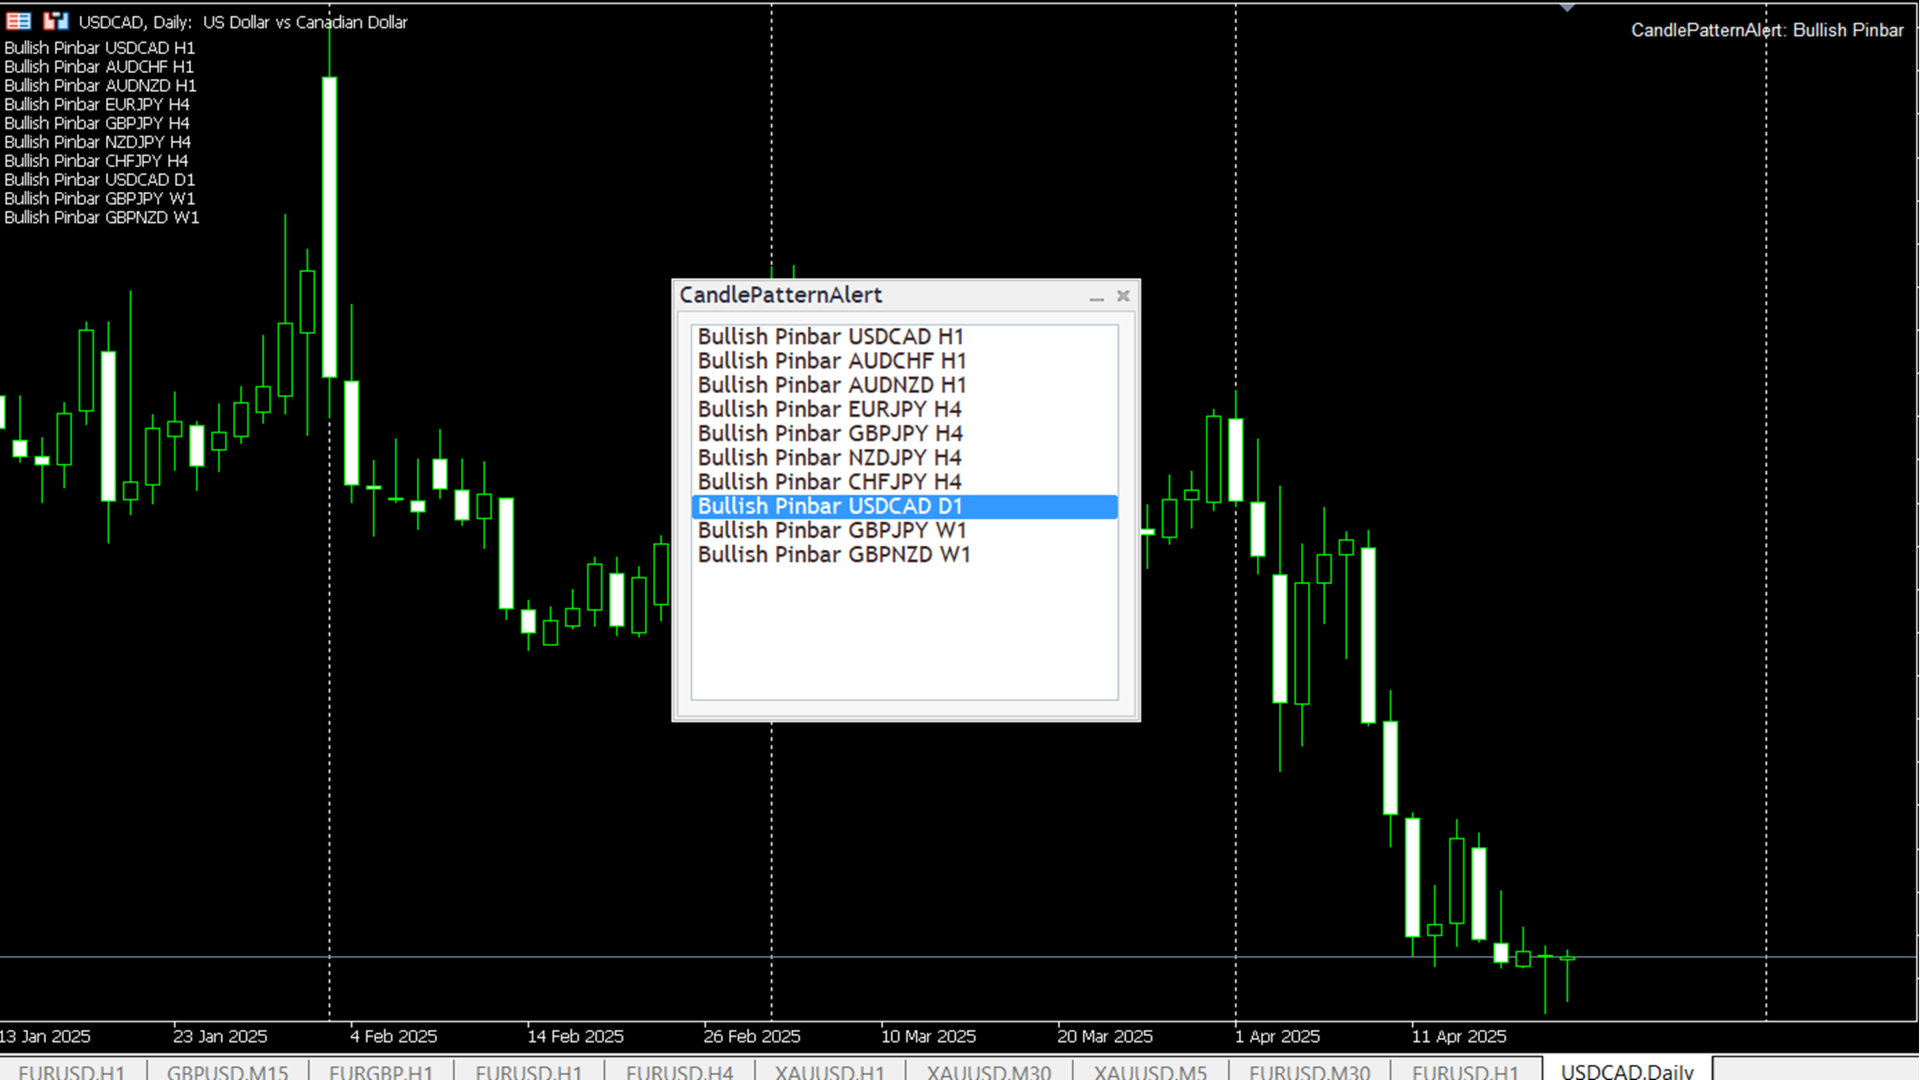
DerCandle Pattern Alert-Indikator warnt Sie, wenn die zuletzt geschlossene Kerze mit den eingegebenen Parametern übereinstimmt. Sie können wählen, ob Sie alle Symbole in Market Watch durchsuchen oder Ihre bevorzugten Symbole eingeben möchten, und Sie können auch Zeitrahmen eingeben, die Sie durchsuchen möchten.
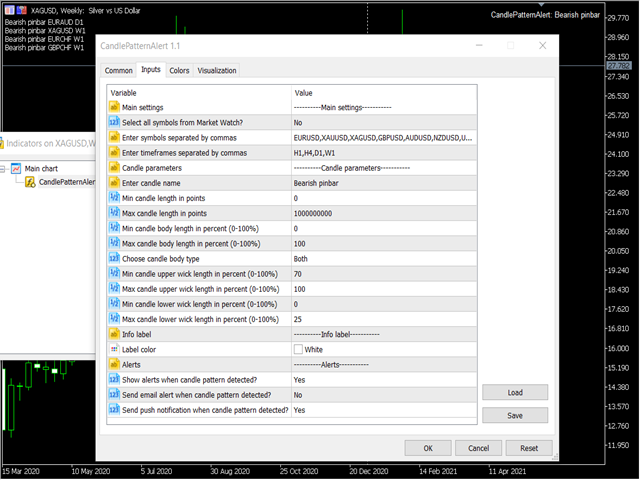
---------Haupteinstellungen--------
- Alle Symbole aus Market Watch auswählen? - Wenn Ja, scannt das Programm alle in Market Watch angezeigten Symbole, wenn Nein , werden nur die in der nächsten Eingabe ausgewählten Symbole gescannt.
- Symbole durch Komma getrennt eingeben - Symbole durch Komma getrennt eingeben (sie müssen in Market Watch ausgewählt sein)
- Zeitrahmen durch Komma getrennt eingeben - Zeitrahmen durch Komma getrennt eingeben, z.B. M1,M2...M30,H1,H2...H12, D1,W1,MN1.
--------Candle parameters--------
- Kerzenname eingeben - Name für das Kerzenmuster eingeben
- Minimale Kerzenlänge in Punkten - geben Sie die minimale Kerzenlänge in Punkten ein
- Maximale Kerzenlänge in Punkten - Eingabe der maximalen Kerzenlänge in Punkten
- Min. Kerzenkörperlänge in Prozent (0-100%) - Eingabe der minimalen Kerzenkörperlänge in Prozent (0-100%)
- Maximale Kerzenkörperlänge in Prozent (0-100%) - Geben Sie die maximale Kerzenkörperlänge in Prozent ein (0-100%)
- Kerzenkörpertyp auswählen - wählen Sie aus dem Dropdown-Menü: bullish, bearish, both
- Min. Kerzendochtlänge in Prozent (0-100%) - geben Sie die minimale Kerzendochtlänge in Prozent ein (0-100%)
- Max Kerze obere Dochtlänge in Prozent (0-100%) - Geben Sie die maximale obere Dochtlänge der Kerze in Prozent (0-100%) ein.
- Min Kerze untere Dochtlänge in Prozent (0-100%) - Min Kerze untere Dochtlänge in Prozent (0-100%) eingeben
- Max Kerze untere Dochtlänge in Prozent (0-100%) - Geben Sie die maximale Kerze untere Dochtlänge in Prozent (0-100%) ein.
---------Info Beschriftung---------
- Farbe der Beschriftung - wählen Sie die Farbe für den Beschriftungstext aus (sie wird in der rechten oberen Ecke angezeigt. Wenn Sie die Beschriftung nicht sehen wollen, wählen Sie die gleiche Farbe wie der Hintergrund)
---------Alerts---------
- Warnungen anzeigen, wenn ein Kerzenmuster erkannt wird? - Wählen Sie Ja oder Nein aus dem Dropdown-Menü
- E-Mail-Benachrichtigung senden, wenn ein Kerzenmuster erkannt wird? - Wählen Sie Ja oder Nein aus dem Dropdown-Menü. Wenn Ja, müssen Sie Ihre E-Mail-Einstellungen im Menü Optionen/E-Mail konfigurieren.
- Push-Benachrichtigung senden, wenn ein Kerzenmuster erkannt wird? - Wählen Sie Ja oder Nein aus dem Dropdown-Menü. Wenn Ja, müssen Sie Ihre MetaQuotes ID im Menü Optionen/Benachrichtigungen einstellen.
Anmerkungen:
- Die Länge des Kerzenkörpers und der Dochte wird in Prozent der Gesamtlänge der Kerze gemessen.
- Wenn Sie mehr als einen Kerzenmuster-Indikator auf einen Bildschirm schieben, dann funktionieren die Alarme von allen Indikatoren, aber die Informationen auf dem Bildschirm werden nur vom letzten Indikator angezeigt.
- Im Testmodus können Sie die Alarme nur auf der Registerkarte " Journale " sehen.