Pivot levels
- Indikatoren
- Version: 1.11
- Aktualisiert: 3 April 2023

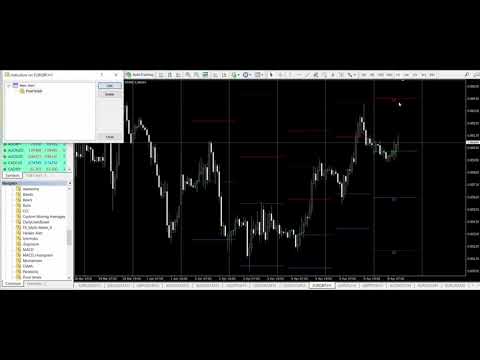
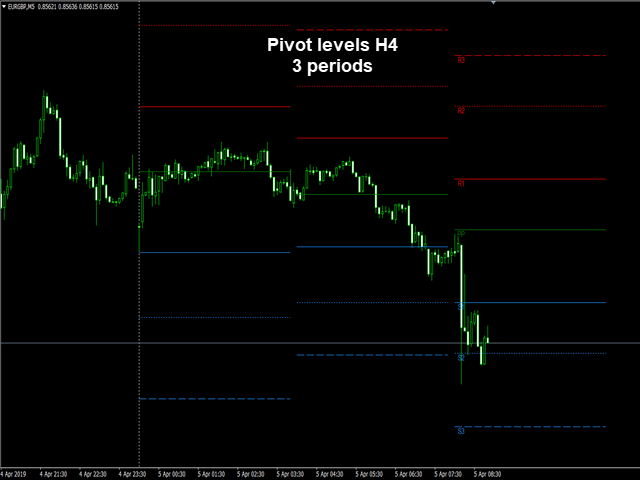
Pivot Levels ist ein Indikator, der 7 Pivot Levels anzeigt. Er ist für die wichtigsten Anwendungen angepasst, darunter:
- alle Standard-Zeitrahmen
- Auswahl der anzuzeigenden Perioden
- drei beliebte Berechnungsformeln (typisch, Median, gewichtet)
- 9 Ebenen Camarilla Pivot
- Pivot-Tagesverschiebung
- Auswahl von Eigenschaften für Linien und Beschriftungen
- Wahl der Anzeige von Warnungen beim Überschreiten von Pivot-Linien
Parameter:
----------Main parameters-----------
- Zeitrahmen - Zeitrahmen für Pivot-Ebenen
- Anzahl der anzuzeigenden Perioden - zeigt die Pivot-Ebenen für eine bestimmte Anzahl von Perioden an
- Berechnungsformel - vier Berechnungsformeln (typisch, Median, gewichtet und Camarilla) können gewählt werden
- Pivot-Tagesverschiebung - Offset von der GMT-Zeit
----------Linien und Beschriftungen-----------
- Linien für letzte Periode verlängern? - wenn ja, werden die Pivot-Linien der letzten Periode verlängert
- Übergänge zwischen den Perioden anzeigen? - wenn wahr, werden die Übergänge angezeigt, wenn falsch , werden die Übergänge ausgeblendet
- Beschriftungen anzeigen? - wenn wahr, werden die Beschriftungen angezeigt, wenn falsch , werden sie ausgeblendet
- Schriftgröße für Beschriftungen - Schriftgröße für Beschriftungen eingeben
- Balkenversatz für Beschriftungen - Geben Sie die Anzahl der Balken ein, um die Position der Beschriftungen zu verschieben (+ nach rechts)
- Farbe der Pivotlinie - wählen Sie die Farbe der Linie
- Pivot-Linienstil - wählen Sie den Linienstil
-----------------Alerts-----------------
- Alarme anzeigen? - wenn wahr, wird ein Alarm angezeigt, wenn der Preis das Pivot-Niveau überschreitet, wenn falsch , werden keine Alarme angezeigt
- Push-Benachrichtigung senden, wenn der Preis das Niveau überschreitet? - wenn wahr, wird eine Benachrichtigung an Ihr Mobiltelefon gesendet, wenn der Preis das Pivot-Niveau überschreitet
Für Rabatte gehen Sie auf https://premiumtrading.co/?ref=13525 und wählen Sie einen Broker.

Perfect for Pivot trading! I just wish it included mid-Pivots