SR levels true
- Indicatori
- Versione: 1.0
- Attivazioni: 5

Indicator SR levels true in small time frames is very useful for scalping while in bigger ones it is good for day or position trading.
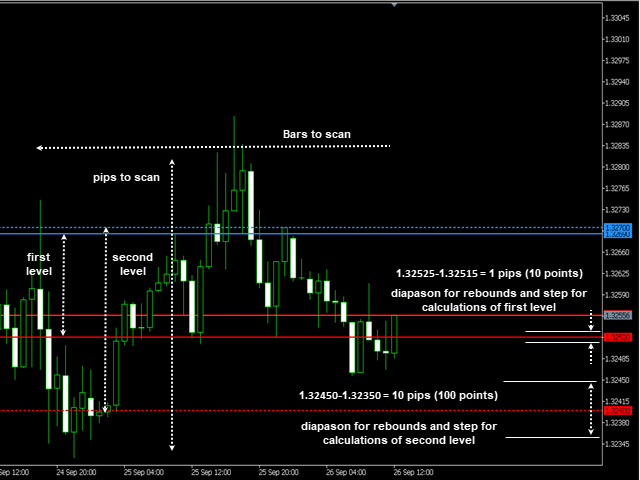
SR levels true can draw 4 support/resistance levels based on defined maximum rebouds from price level. Indicator scans defined number of bars in time axis and defined number of pips in price axis (both sides - up and down) and calculates how much times price was rejected from scanned price levels. At the price levels where maximum rebounds are counted, support or resistance levels accordingly are drawn.
Important to mention that for the first level the price level diapason (or width) to reject from is 1 pip by default and for the second level it is 10 pips. If the pip value of the equity is very small (for example bitcoin) it is sensible to increase the pip power value from default 1 to 2 or higher. If the pip power value is 2, it means that for the first level the price diapason to reject from is 10 pips and for the second - 100 pips. For more clarity you can see first screenshot.
Also have in the mind that if you set for example 50 pips to scan it means that for the first level indicator scans 50 pips in both directions with step equal 1 pip and for the second level it scans 500 pips with step equal 10 pips.
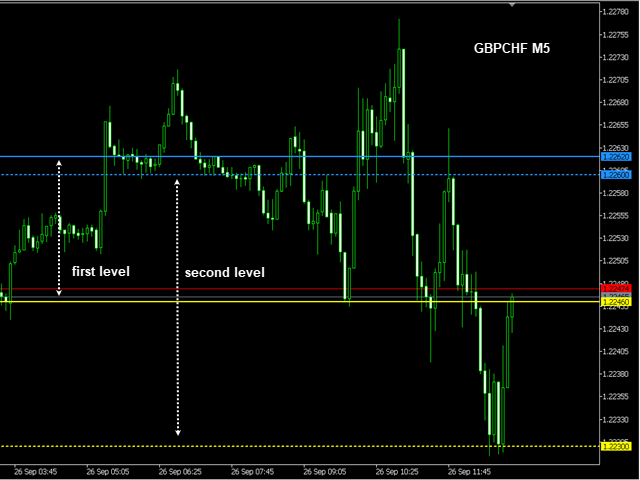
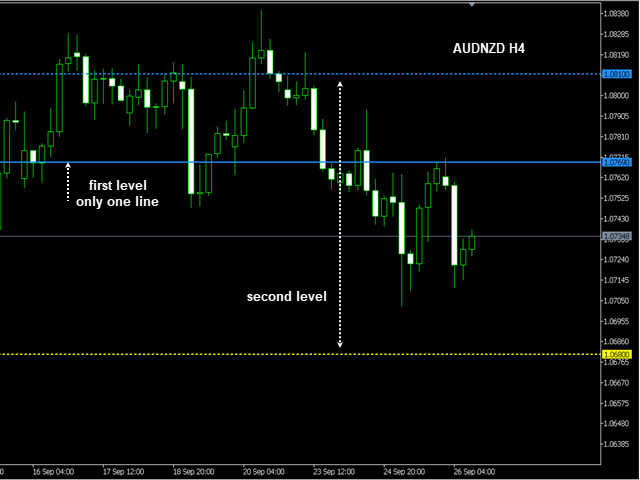
Sometimes second level lines may occur between first level lines or if there is not enough number of rebounds level is not drawn at all.
Input parameters:
Main settings
- Bars to scan - choose number of bars to scan
- Pips to scan - choose number of pips to scan for one direction
- Rebounds min - enter the number of minimum rebounds to draw the line
- Pip power - decimal degree. 1 means 1 pip (10 points), 2 mean 10 pip (100 points) and so on.
Lines settings
- Level color - select color from drop down menu
- Level width - enter integer number
- Level style - select style from drop down menu