• Übersicht
  • Bewertungen (2)
  • Diskussion (24)
  • Neue Funktionen

Swiss ORIndicator

Opening Range Indicator


Idee

Die Opening Range Strategie wurde zum ersten Mal von Tobi Crabel in den 90ern publiziert. In der Zwischenzeit haben sich die Märkte verändert, jedoch scheint die Opening Range insbesondere beim Indextrading immer noch sehr signifikant zu sein. 

Das Prinzip ist folgendes: Man zeichnet die Grenzen der ersten Stundenkerze in den Chart. Die Länge der Range wird mit "stretch" bezeichnet.  Ein Ausbruch nach oben aus der Range wird wie folgt getradet: Stopp Loss an der unteren Opening Range (Ausbruchslevel-Stetch) und Take Profit am Ausbruchslevel plus Stetch. Beispiel: Die Kerze des Dax von 8:00 bis 9:00 messe 40 Punkte. Die Oberkante läge bei 12000 Punkten. Bei einem Ausbruch nach oben läge der Stopp Loss bei 11960 Punkten und der Take Profit bei 12040 Punkten. In dieser klassischen Anwendungsweise ergeben sich sehr grosse Stopp Loss Distanzen. Ich empfehle, diese auf maximal 20 Punkte für den Dax zu limitieren. 

Features

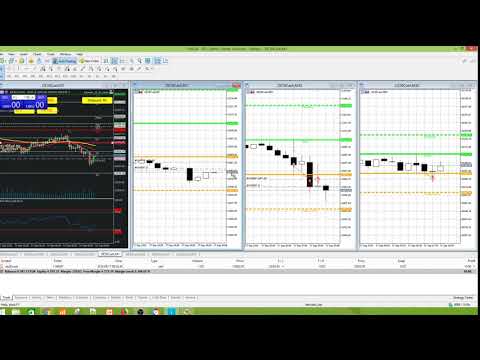
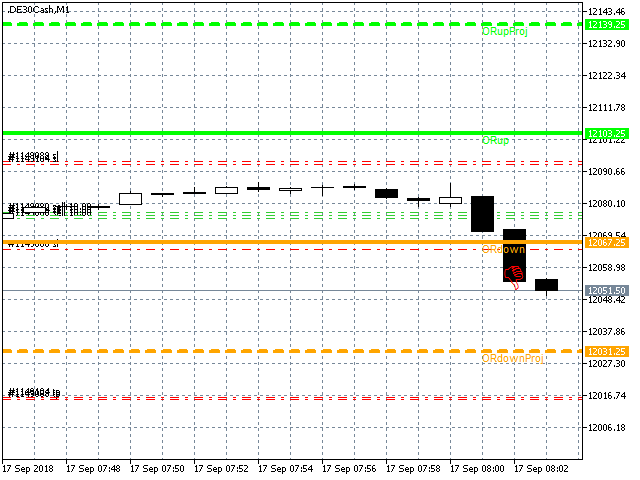
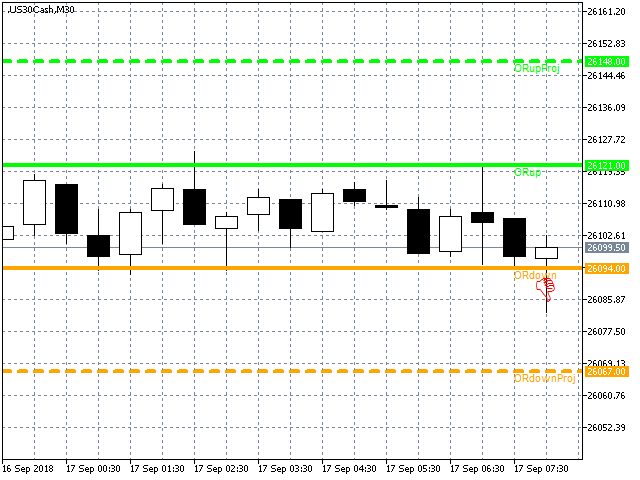
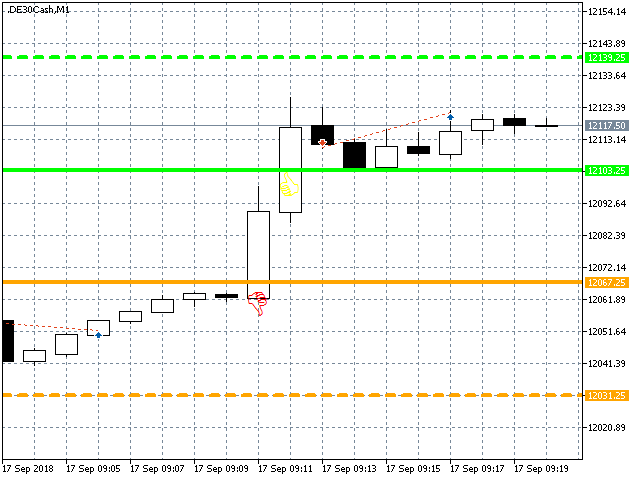
  • Zeichnet die Levels der vorangegangenen Stunde und die Projektionen
  • Warnung bei Überschreiten der Niveaus
  • Wahl zwischen Lokal- und Serverzeit
  • Möglichkeit, die Levels von Hand einzugeben
  • Die OR-Daten werden in globale Variablen gespeichert (f3)
  • Es können mehrere Assets gleichzeitig markiert werden
  • Die Werte bleben erhalten, falls Sie die Zeiteinheit wechseln

Installation


Speichern Sie Ihre Einstellungen in einem set-File.

Die Variablen der OR (obere, untere, Eröffnungslinie) werden in globale Variablen gespeichert, die Sie mit f3 betrachten können


Anwendung


Sie können zwischen Lokalzeit (Zeit Ihres PCs) oder Serverzeit (Zeit Ihres Brokers) wählen. Default ist Lokalzeit.

Falls Sie 9 für die Stunde und 1 für die Minute eingegeben haben, zeichnet der Indikator die Levels um 09:01 Lokalzeit. 

Wegen der zahlreichen Fehlausbrüche kann die Anwendung der klassischen ORB Strategie zu massiven Verlusten führen. Des weiteren schlage ich vor, auf einen Ausbruch nicht nur 10 Minuten zu warten, sondern eine Stunde. Informieren Sie sich über die Opening Range Strategie.

Inputs

  • Opening Time Hour
  • Opening Time Minute
  • Chose local vs. server time
  • Allow input range by hand
  • Upper limit by hand
  • Lower limit by hand
  • Customice line and icon colors
  • Turn on/off talking when price crosses levels
  • Draw icons if price crosses levels
  • Turn on deug info (time is displayed)
  • Shift labels if the collide with labels of other indicators

Probleme

Der Indikator ist auf einen Tick innerhalb einer Minute angewiesen. Bei sehr lahmen Märkten kann es vorkommen, dass die Startzeit nicht getriggert wird, weil kein Tick in der entsprechenden Minute vorhanden war.

Disclaimer

Dieses Tool garantiert keinen Tradingerfolg.


05.02.2018, Terence V. Gronowski "SwissTrader".


Empfohlene Produkte
"Hunttern harmonic pattern finder" base on the dynamic zigzag with the notification and prediction mode This version of the indicator identifies 11 harmonic patterns and predicts them in real-time before they are completely formed. It offers the ability to calculate the error rate of Zigzag patterns depending on a risk threshold. It moreover sends out a notification once the pattern is complete. The supported patterns: ABCD BAT ALT BAT BUTTERFLY GARTLEY CRAB DEEP CRAB CYPHER SHARK THREE
FREE
Free automatic Fibonacci is an indicator that automatically plots a Fibonacci retracement based on the number of bars you select on the BarsToScan setting in the indicator. The Fibonacci is automatically updated in real time as new highest and lowest values appears amongst the selected bars. You can select which level values to be displayed in the indicator settings. You can also select the color of the levels thus enabling the trader to be able to attach the indicator several times with differe
FREE
Functional in the Forex market. Functional in the B3 market - Bolsa Brasil Balcão. Motivation The technical Fibonacci retraction indicator for many is essential and the basis for all market movement forecasts. The name of the tool comes from the Italian mathematician Leonardo de Pisa (13th century). This DEMO version will work in Meta Trader with Demo and Strategy Tester. To purchase the Full version that works on a Real account, click on: https://www.mql5.com/en/market/product/38089
FREE
All Harmonics 26 demo
Alexey Isavnin
4.22 (9)
This is the demo version of "All Harmonics 26" indicator . "All Harmonics 26" searches for 26 types of harmonic patterns and outputs them in a convenient way. You can check out the documentation here . This demo version has the following limitations: The indicator searches only for one type of harmonic patterns out of 26:- Gartley. The indicator outputs new patterns with a lag of 10 bars.
FREE
Central Pivot Tool MT5
Conor Stephenson
5 (8)
Die Ebenen des zentralen Pivot-Bereichs werden um einen zentralen Pivot-Punkt herum gebildet. Diese Niveaus in Bezug auf den zentralen Pivot können verwendet werden, um zahlreiche Marktverhalten und mögliche Ergebnisse zu bestimmen. Die Entfernung vom zentralen Pivot und der Preis, den sich neue Niveaus im Verhältnis zu den Niveaus des Vortages bilden, können verwendet werden, um die Trendrichtung und -stärke der folgenden Tage zu bestimmen. Central Pivot Ranges können als Unterstützung u
FREE
Valable ZigZag MT5
Sergey Ermolov
4.75 (16)
MT4-Version  |  Trend Monitor VZ-Indikator  |  Owl Smart Levels-Indikator   |  Owl Smart Levels-Strategie  |   FAQ Die Elliott-Wellentheorie ist eine Interpretation von Prozessen an den Finanzmärkten, die auf einem visuellen Wellenmodell in den Preisdiagrammen beruht. Der Valable ZigZag Indikator zeigt die Wellenstruktur des Marktes an, auf die Sie sich verlassen können, um Handelsentscheidungen zu treffen. Der Valable ZigZag-Indikator ist stabiler und ändert seine Richtung nicht oft wie der kl
FREE
PZ Penta O MT5
PZ TRADING SLU
4 (6)
The Penta-O is a 6-point retracement harmonacci pattern which usually precedes big market movements. Penta-O patterns can expand and repaint quite a bit. To make things easier this indicator implements a twist: it waits for a donchian breakout in the right direction before signaling the trade. The end result is an otherwise repainting indicator with a very reliable trading signal. The donchian breakout period is entered as an input. [ Installation Guide | Update Guide | Troubleshooting | FAQ | A
FREE
Babel Assistant
Iurii Bazhanov
4.33 (6)
Babel assistant 1     The MT5 netting “Babel_assistant_1” robot uses the ZigZag indicator to generate Fibonacci levels on M1, M5, M15, H1, H4, D1, W1  periods of the charts , calculates the strength of trends for buying and selling. It opens a position with "Lot for open a position" if the specified trend level 4.925 is exceeded. Then Babel places pending orders at the some Fibonacci levels and places specified Stop Loss , Take Profit. The screen displays current results of work on the positio
FREE
Forex Time
Yuriy Ponyatov
An indicator for visualizing time ranges of key trading sessions: Asian, European, and American. The indicator features functionality for setting the start and end times of each trading session, as well as an adjustable timezone of the trading server. The main advantages of the indicator include the ability to operate with minimal CPU load and memory usage. Moreover, it offers the option to specify the number of displayed historical days, providing the user with flexible market dynamics analysis
FREE
PZ Three Drives MT5
PZ TRADING SLU
3.11 (9)
This indicator finds Three Drives patterns. The Three Drives pattern is a 6-point reversal pattern characterised by a series of higher highs or lower lows that complete at a 127% or 161.8% Fibonacci extension. It signals that the market is exhausted and a reversal can happen. [ Installation Guide | Update Guide | Troubleshooting | FAQ | All Products ] Customizable pattern sizes Customizable colors and sizes Customizable breakout periods Customizable 1-2-3 and 0-A-B ratios It implements visua
FREE
Spike Catch Pro
Amani Fungo
4 (5)
Spike Catch Pro 22:03 release updates Advanced engine for searching trade entries in all Boom and Crash pairs (300,500 and 1000) Programmed strategies improvements Mx_Spikes (to combine Mxd,Mxc and Mxe), Tx_Spikes,   RegularSpikes,   Litho_System,   Dx_System,   Md_System,   MaCross,   Omx_Entry(OP),  Atx1_Spikes(OP),   Oxc_Retracement (AT),M_PullBack(AT) we have added an arrow on strategy identification, this will help also in the visual manual backtesting of the included strategies and see h
FREE
Stackable VWAP
Flavio Javier Jarabeck
3.33 (6)
Volume Weighted Average Price (VWAP) is a trading benchmark commonly used by Big Players that gives the average price a Symbol has traded throughout the day. It is based on both Volume and price. Additionally we put in this indicator the MVWAP (Moving Volume Weighted Average Price). For those who do not know the usage and the importance od this indicator I recommend a great article about this subject at Investopedia ( https://www.investopedia.com/articles/trading/11/trading-with-vwap-mvwap.asp
FREE
Cybertrade Keltner Channels
Emanuel Andriato
4.67 (3)
Cybertrade Keltner Channels - MT5 Created by Chester Keltner, this is a volatility indicator used by technical analysis. It is possible to follow the trend of financial asset prices and generate support and resistance patterns. In addition, envelopes are a way of tracking volatility in order to identify opportunities to buy and sell these assets. It works on periods longer than the period visible on the chart. All values ​​are available in the form of buffers to simplify possible automations.
FREE
Pivot Point Fibo RSJ ist ein Indikator, der die Unterstützungs- und Widerstandslinien des Tages mithilfe von Fibonacci-Kursen verfolgt. Dieser spektakuläre Indikator erzeugt bis zu 7 Unterstützungs- und Widerstandsebenen durch Pivot Point unter Verwendung von Fibonacci-Kursen. Es ist fantastisch, wie die Preise jedes Niveau dieser Unterstützung und dieses Widerstands respektieren, wo es möglich ist, mögliche Einstiegs- / Ausstiegspunkte einer Operation zu erkennen. Merkmale Bis zu 7 Unter
FREE
Bar Color Trend
Germano Chagas
4.5 (10)
Combining the best of Price Action , Directional Movement , and Divergence/Convergence analysis, Candle Color Trend is a easy and reliable way to identify trend direction. The indicator automatically paints the candles according to the assumption that an uptrend is defined by prices that form a series of higher highs and higher lows. In contrast, a downtrend is defined by prices that form a series of lower highs and lower lows. Additionally, ADX Wilder indicator is used to measure trend weakness
FREE
Super Trend eu
Emin Ulucanli
5 (3)
SUPERTREND; Es ist ein Trendfolgeindikator, der auf dem von Olivier Seban erstellten SuperTrend ATR basiert. Es kann verwendet werden, um Änderungen in der Trendrichtung zu erkennen und Stopps zu lokalisieren. Wenn der Preis unter die Indikatorkurve fällt, wird er rot und zeigt einen Abwärtstrend an. Wenn sich der Preis dagegen über die Kurve bewegt, wird der Indikator grün und zeigt einen Aufwärtstrend an. Wie andere Indikatoren funktioniert es gut auf SuperTrend, wenn es in Verbindung mit ande
FREE
Pipsometer
Andrew Ingosi Likare
4.67 (3)
This is an indicator that shows total pips ,order counts and the total profit accumulated for the open orders of the pair attached. The colors change depending on if the total profit is positive , negative or zero. Contact: If you have some questions or if you need help, kindly contact me via Private Message. Author: A.L.I, fintech software engineer and a passionate forex trader.
FREE
Necessary for traders: tools and indicators Waves automatically calculate indicators, channel trend trading Perfect trend-wave automatic calculation channel calculation , MT4 Perfect trend-wave automatic calculation channel calculation , MT5 Local Trading copying Easy And Fast Copy , MT4 Easy And Fast Copy , MT5 Local Trading copying For DEMO Easy And Fast Copy , MT4 DEMO Easy And Fast Copy , MT5 DEMO Fortgeschrittene Bollinger Bands: 1. Die Bollinger-Schiene ändert ihre Farbe mit der Richtun
FREE
This is a buyer and seller aggression indicator that analyzes the shape of each candle and project this data in a histogram form. There are 4 histograms in one. On the front we have two: Upper - Buyer force. Lower - Seller force. At the background we also have two histogram, both with same color. They measure the combined strenght of buyers and sellers. This histograms can be turned off in Input Parameters. It is also possible to have the real or tick volume to help on this force measurement. IN
FREE
Peak Trough Analysis is the great tool to detect peaks and troughs in your chart. Peak Trough Analysis tool can use three different peaks and troughs detection algorithm. The three algorithm include the orignal Fractals Indicator by Bill Williams, the Modified Fractals indicator and ZigZag indicator. You can use this peak and trough analysis tool to detect the price pattern made up from Equilibrium Fractal-Wave process. For further usage, there are good guide line on how to use this peak trough
FREE
WH DrawFib Pro MT5
Wissam Hussein
4.8 (5)
Sind Sie es leid, Fibonacci-Levels manuell in Ihre Diagramme einzutragen? Suchen Sie nach einer bequemen und effizienten Möglichkeit, wichtige Unterstützungs- und Widerstandsniveaus in Ihrem Handel zu identifizieren? Suchen Sie nicht weiter!   Wir stellen Ihnen DrawFib Pro vor, den ultimativen MetaTrader 5-Indikator, der automatische   Fibonacci-   Level   durchführt       Es greift auf Ihre Diagramme zurück und gibt rechtzeitige Warnungen aus, wenn diese Werte überschritten werden. Mit DrawFib
FREE
FusionAlert StochRSI Master is an indicator available for MT4/MT5 platforms, it is a combination of RSI & Stochastic indicator which provide "alerts" when the market is inside "overbought and oversold" regions combined for both indicators, results in more precise and accurate signals to be used as a wonderful tool, in the form of "buy or sell" signals. This indicator comes with many customization options mentioned in the parameter section below, user can customise these parameters as needful. Jo
FREE
Novato
Juan Manuel Rojas Perez
5 (1)
Descubre el poderoso aliado que te guiará en el laberinto de los mercados financieros. Este indicador revolucionario te llevará de la incertidumbre a la claridad, permitiéndote identificar con precisión los puntos de inflexión del mercado. Mejora tus decisiones de entrada y salida, optimiza tus operaciones y ¡multiplica tus ganancias con confianza. ¡Para más información, te invitamos a unirte a nuestro canal de Telegram en https://t.me/Profit_Evolution  ¡Allí encontrarás contenido exclusivo, a
FREE
Novato alertas
Juan Manuel Rojas Perez
5 (2)
Descubre el poderoso aliado que te guiará en el laberinto de los mercados financieros. Este indicador revolucionario te llevará de la incertidumbre a la claridad, permitiéndote identificar con precisión los puntos de inflexión del mercado. Mejora tus decisiones de entrada y salida, optimiza tus operaciones y ¡multiplica tus ganancias con confianza. Ahora con alertas en tu pc o móvil ¡Para más información, te invitamos a unirte a nuestro canal de Telegram en   https://t.me/Profit_Evolution  ¡
FREE
PZ Fibonacci MT5
PZ TRADING SLU
4.63 (16)
Are you tired of plotting Fibonacci retracements or extensions manually? This indicator displays Fibo retracements or extensions automatically, calculated from two different price points, without human intervention or manual object anchoring. [ Installation Guide | Update Guide | Troubleshooting | FAQ | All Products ] Easy to use Manual anchoring is not needed Perfect for price confluence studies The indicator evaluates if retracements or extensions are needed Once drawn, you can manually edit t
FREE
Japanese candlestick analysis has been in existence for hundreds of years and is a valid form of technical analysis. Candlestick charting has its roots in the militaristic culture that was prevalent in Japan in the 1700s. One sees many terms throughout the Japanese literature on this topic that reference military analogies, such as the Three White Soldiers pattern Unlike more conventional charting methods, candlestick charting gives a deeper look into the mind-set of investors, helping to establ
FREE
VWAP and MVWAP
Flavio Javier Jarabeck
4.17 (6)
Volume Weighted Average Price (VWAP) is a trading benchmark commonly used by Big Players that gives the average price a Symbol has traded throughout the day. It is based on both Volume and price. Additionally we put in this indicator the MVWAP (Moving Volume Weighted Average Price). For those who do not know the usage and the importance od this indicator I recommend a great article about this subject at Investopedia ( https://www.investopedia.com/articles/trading/11/trading-with-vwap-mvwap.asp )
FREE
Are you tired of drawing trendlines every time you're analyzing charts? Or perhaps you would like more consistency in your technical analysis. Then this is for you. This indicator will draw trend lines automatically when dropped on a chart. How it works Works similar to standard deviation channel found on mt4 and mt5. It has 2 parameters: 1. Starting Bar 2. Number of bars for calculation The   starting bar   is the bar which drawing of the trend lines will begin, while the   number of bars for c
FREE
UPD1 X00 Levels MT5
Vitaliy Kuznetsov
5 (1)
Der Indikator zeigt   runde Level   auf dem Chart an. Sie werden auch   psychologische , Bank- oder Major Player Level genannt. Auf diesen Niveaus gibt es einen echten Kampf zwischen Bullen und Bären, die Anhäufung vieler Orders, was zu einer erhöhten Volatilität führt. Der Indikator passt sich   automatisch   an jedes Instrument und jeden Zeitrahmen an. Wenn das   Level 80   durchbrochen und dann getestet ist,   kaufen wir . Wenn   Level 20   durchbrochen und dann getestet wird,   verkaufen wi
FREE
This tool is useful for indicating resistance and support levels It bases on zone in setting to identify top/bottom of candles and and draw rectangle according to those resistance/support level Beside user can edit the zone via dialog on specific timeframe and that value will be saved and loaded automatically. User can determine what strong resistance and support and make the order reasonably.
FREE
Käufer dieses Produkts erwarben auch
Atomic Analyst MT5
Issam Kassas
4.22 (9)
Zunächst einmal ist es erwähnenswert, dass dieser Handelsindikator nicht neu malt, nicht neu zeichnet und keine Verzögerung aufweist, was ihn sowohl für manuellen als auch für Roboterhandel ideal macht. Der Atom-Analyst ist ein PA-Preisaktionsindikator, der die Stärke und das Momentum des Preises nutzt, um einen besseren Vorteil auf dem Markt zu finden. Ausgestattet mit fortschrittlichen Filtern, die helfen, Rauschen und falsche Signale zu entfernen, und das Handelspotenzial zu erhöhen. Durch
Zunächst einmal ist es wichtig zu betonen, dass dieses Handelssystem ein Nicht-Repainting-, Nicht-Redrawing- und Nicht-Verzögerungsindikator ist, was es sowohl für manuelles als auch für automatisches Trading ideal macht. Das "Smart Trend Trading System MT5" ist eine umfassende Handelslösung, die für neue und erfahrene Trader maßgeschneidert ist. Es kombiniert über 10 Premium-Indikatoren und bietet mehr als 7 robuste Handelsstrategien, was es zu einer vielseitigen Wahl für verschiedene Marktbe
Quantum Trend Sniper
Bogdan Ion Puscasu
5 (36)
Wir stellen vor       Quantum Trend Sniper Indicator   , der bahnbrechende MQL5-Indikator, der die Art und Weise, wie Sie Trendumkehrungen erkennen und handeln, verändert! Entwickelt von einem Team erfahrener Händler mit über 13 Jahren Handelserfahrung,       Quantum Trend Sniper-Indikator       wurde entwickelt, um Ihre Trading-Reise mit seiner innovativen Methode zur Identifizierung von Trendumkehrungen mit extrem hoher Genauigkeit auf ein neues Niveau zu heben. ***Kaufe Quantum Trend Snipe
Gold Stuff mt5
Vasiliy Strukov
4.88 (162)
Gold Stuff mt5-Ein Trendindikator, der speziell für Gold entwickelt wurde, kann auch auf allen Finanzinstrumenten verwendet werden. Der Indikator wird nicht neu gezeichnet und verzögert sich nicht. Empfohlener Zeitrahmen H1. WICHTIG! Kontaktieren Sie mich sofort nach dem Kauf, um Anweisungen und Bonus zu erhalten! DATEN Draw Arrow - inkl.aus. zeichnen von Pfeilen in einem Diagramm. Alerts-inkl.aus.akustische Warnungen. E - mail notification-inkl.aus. benachrichtigungen per E-Mail. Puch-
Trend Screener Pro MT5
STE S.S.COMPANY
4.88 (60)
Nutzen Sie die Macht des Trendhandels mit Trend Screener Indicator: Ihrer ultimativen Trendhandelslösung, die auf Fuzzy-Logik und einem System mit mehreren Währungen basiert! Steigern Sie Ihren Trendhandel mit Trend Screener, dem revolutionären Trendindikator mit Fuzzy-Logik. Es handelt sich um einen leistungsstarken Trendfolgeindikator, der über 13 Premium-Tools und -Funktionen sowie 3 Handelsstrategien kombiniert und ihn zu einer vielseitigen Wahl macht, um Ihren Metatrader in einen Trendanaly
Advanced Supply Demand MT5
Bernhard Schweigert
4.53 (15)
Derzeit 33% Rabatt! Die beste Lösung für jeden Anfänger oder erfahrenen Händler! Dieser Indikator ist ein einzigartiges, qualitativ hochwertiges und erschwingliches Trading-Tool, da wir eine Reihe von proprietären Funktionen und eine neue Formel integriert haben. Mit diesem Update werden Sie in der Lage sein, doppelte Zeitrahmenzonen anzuzeigen. Sie können nicht nur einen höheren TF (Zeitrahmen) anzeigen, sondern sowohl den Chart-TF als auch den höheren TF: SHOWING NESTED ZONES. Alle Supply Dema
RelicusRoad Pro MT5
Relicus LLC
4.81 (21)
Jetzt 147 US -Dollar (nach ein paar Aktualisierungen auf 499 US -Dollar) - Unbegrenzte Konten (PCs oder MACs) RelicusRoad Benutzerhandbuch + Schulungsvideos + Zugang zur privaten Discord-Gruppe + VIP-Status EINE NEUE ART, DEN MARKT ZU BETRACHTEN RelicusRoad ist der weltweit leistungsstärkste Handelsindikator für Forex, Futures, Kryptowährungen, Aktien und Indizes und gibt Händlern alle Informationen und Tools, die sie benötigen, um profitabel zu bleiben. Wir bieten technische Analysen un
Zunächst einmal ist es wichtig zu betonen, dass dieses Handelstool ein Nicht-Repaint-, Nicht-Redraw- und Nicht-Verzögerungsindikator ist, was es ideal für professionelles Trading macht. Der Smart Price Action Concepts Indikator ist ein sehr leistungsstarkes Werkzeug sowohl für neue als auch erfahrene Händler. Er vereint mehr als 20 nützliche Indikatoren in einem und kombiniert fortgeschrittene Handelsideen wie die Analyse des Inner Circle Traders und Strategien des Smart Money Concepts. Diese
Wir stellen vor       Quantum Breakout PRO   , der bahnbrechende MQL5-Indikator, der die Art und Weise, wie Sie mit Breakout-Zonen handeln, verändert! Entwickelt von einem Team erfahrener Händler mit über 13 Jahren Handelserfahrung,       Quantum Breakout PRO       ist darauf ausgelegt, Ihre Handelsreise mit seiner innovativen und dynamischen Breakout-Zone-Strategie auf ein neues Niveau zu heben. Der Quantum Breakout Indicator zeigt Ihnen Signalpfeile auf Breakout-Zonen mit 5 Gewinnzielzone
FX Power MT5 NG
Daniel Stein
5 (4)
Erhalten Sie Ihr tägliches Marktupdate mit Details und Screenshots über unser Morning Briefing hier auf mql5 und auf Telegram ! FX Power MT5 NG ist die nächste Generation unseres langjährig sehr beliebten Währungsstärkemessers FX Power. Und was bietet dieser Stärkezähler der nächsten Generation? Alles, was Sie am ursprünglichen FX Power geliebt haben PLUS GOLD/XAU-Stärkeanalyse Noch präzisere Berechnungsergebnisse Individuell konfigurierbare Analysezeiträume Anpassbares Berechnungslimit für noc
AW Trend Predictor MT5
AW Trading Software Limited
4.76 (54)
Die Kombination von Trend- und Aufschlüsselungsebenen in einem System. Ein fortschrittlicher Indikatoralgorithmus filtert Marktrauschen, bestimmt den Trend, Einstiegspunkte sowie mögliche Ausstiegsniveaus. Indikatorsignale werden in einem Statistikmodul aufgezeichnet, das es Ihnen ermöglicht, die am besten geeigneten Tools auszuwählen, die die Wirksamkeit der Signalhistorie zeigen. Der Indikator berechnet Take-Profit- und Stop-Loss-Marken. Handbuch und Anleitung ->   HIER   / MT4-Version ->   H
FX Volume MT5
Daniel Stein
4.94 (17)
Erhalten Sie Ihr tägliches Marktupdate mit Details und Screenshots über unser Morning Briefing hier auf mql5 und auf Telegram ! FX Volume ist der ERSTE und EINZIGE Volumenindikator, der einen ECHTEN Einblick in die Marktstimmung aus Sicht eines Brokers bietet. Es bietet fantastische Einblicke in die Positionierung von institutionellen Marktteilnehmern, wie z.B. Brokern, auf dem Forex-Markt, viel schneller als COT-Berichte. Diese Informationen direkt auf Ihrem Chart zu sehen, ist der wahre Game
Dies ist ein Indikator für MT5, der genaue Signale für den Einstieg in einen Handel ohne Repainting (Neuzeichnen) liefert. Er kann auf alle Finanzwerte angewendet werden: Forex, Kryptowährungen, Metalle, Aktien, Indizes. Er liefert ziemlich genaue Schätzungen und sagt Ihnen, wann es am besten ist, eine Position zu eröffnen und zu schließen. Sehen Sie sich das Video (6:22) mit einem Beispiel für die Verarbeitung nur eines Signals an, das sich für den Indikator gelohnt hat! Die meisten Händler ver
TPSpro TRENDPRO  - is a trend indicator that automatically analyzes the market and provides information about the trend and each of its changes, as well as giving signals for entering trades without redrawing! The indicator uses each candle, analyzing them separately. referring to different impulses - up or down impulse. Exact entry points into transactions for currencies, crypto, metals, stocks, indices!  -  Version MT4                  DETAILED DESCRIPTION        /       TRADING SETUPS       
Bill Williams Advanced
Siarhei Vashchylka
5 (3)
Bill Williams Advanced is designed for automatic chart analysis using Bill Williams' "Profitunity" system. The indicator analyzes four timeframes at once. Manual (Be sure to read before purchasing) Advantages 1. Automatically analyzes the chart using the "Profitunity" system of Bill Williams. The found signals are placed in a table in the corner of the screen. 2. Equipped with a trend filter based on the Alligator indicator. Most of the system signals are recommended to be used only accordi
ICT, SMC, SMART MONEY CONCEPTS, SMART MONEY, Smart Money Concept, Support and Resistance, Trend Analysis, Price Action, Market Structure, Order Blocks, BOS/CHoCH,   Breaker Blocks ,  Momentum Shift,   Supply&Demand Zone/Order Blocks , Strong Imbalance,   HH/LL/HL/LH,    Fair Value Gap, FVG,  Premium  &   Discount   Zones, Fibonacci Retracement, OTE, Buy Side Liquidity, Sell Side Liquidity, BSL/SSL Taken, Equal Highs & Lows, MTF Dashboard, Multiple Time Frame, BigBar, HTF OB, HTF Market Structure
TrendMaestro5
Stefano Frisetti
note: this indicator is for METATRADER4, if you want the version for METATRADER5 this is the link:  https://www.mql5.com/it/market/product/108106 TRENDMAESTRO recognizes a new TREND in the bud, he never makes mistakes. The certainty of identifying a new TREND is priceless. DESCRIPTION TRENDMAESTRO identifies a new TREND in the bud, this indicator examines the volatility, volumes and momentum to identify the moment in which there is an explosion of one or more of these data and therefore the mome
Auto Order Block with break of structure based on ICT and Smart Money Concepts Futures Break of Structure ( BoS )             Order block ( OB )            Higher time frame Order block / Point of Interest ( POI )    shown on current chart           Fair value Gap ( FVG ) / Imbalance   ,  MTF      ( Multi Time Frame )    Volume Imbalance     ,  MTF          vIMB Gap’s Equal High / Low’s     ,  MTF             EQH / EQL Liquidity               Current Day High / Low           HOD /
TrendDecoder Premium MT5
Christophe, Pa Trouillas
5 (1)
Top bewertet auf anderem MarketPlace -  Jetzt verfügbar auf METATRADER Identifizieren Sie Bereiche und die nächsten wahrscheinlichen Bewegungen     |    Erhalten Sie früheste Signale und die Stärke von Trends     |    Klare Ausstiegssignale vor Umkehrung     |    Erkennen Sie die Fibo-Levels, die der Kurs testen wird    |  Indikator, der nicht zurückverfolgt, nicht verzögert - ideal für den manuellen und automatisierten Trading - geeignet für alle Vermögenswerte und Zeiteinheiten - 50% Rabatt  
XQ Indicator MetaTrader 5
Marzena Maria Szmit
5 (1)
Step into the realm of Forex trading with confidence and precision using XQ, a cutting-edge Forex indicator designed to elevate your trading game to unprecedented heights. Whether you're a seasoned trader or just stepping into the world of currency exchange, XQ Forex Indicator empowers you with the insights and signals needed to make informed trading decisions. The signal conditions are a combination of three indicators, and XQ Forex Indicator only display  medium and long-term trends . The ind
Werden Sie Breaker Trader und profitieren Sie von Änderungen der Marktstruktur, wenn sich der Preis umkehrt. Der Order Block Breaker Indikator zeigt an, wann sich eine Trend- oder Preisbewegung der Erschöpfung nähert und bereit ist, sich umzukehren. Es weist Sie auf Änderungen in der Marktstruktur hin, die normalerweise auftreten, wenn eine Umkehrung oder ein größerer Rückzug bevorsteht. Der Indikator verwendet eine proprietäre Berechnung, die Ausbrüche und Preisdynamik identifiziert. Jedes
TrendLine PRO MT5
Evgenii Aksenov
4.78 (49)
The Trend Line PRO indicator is an independent trading strategy. It shows the trend change, the entry point to the transaction, as well as automatically calculates three levels of Take Profit and Stop Loss protection Trend Line PRO is perfect for all Meta Trader symbols: currencies, metals, cryptocurrencies, stocks and indices Advantages of Trend Line PRO Never redraws its signals The possibility of using it as an independent strategy It has three automatic levels Take Profit and Stop Loss lev
IX Power MT5
Daniel Stein
5 (1)
IX Power   bringt die unschlagbare Präzision von FX Power endlich auch zu Nicht-Forex-Symbolen. Es bestimmt präzise die Intensität von kurz-, mittel- und langfristigen Trends in Ihren Lieblingsindizes, Aktien, Rohstoffen, ETFs und sogar Kryptowährungen. Sie können   alles analysieren, was   Ihr Terminal zu bieten hat. Probieren Sie es aus und erleben Sie, wie   sich Ihr Timing   beim Handel   deutlich verbessert . IX Power Hauptmerkmale 100% präzise, nicht nachpinselnde Berechnungsergebni
The Volume by Price Indicator for MetaTrader 5 features Volume Profile and Market Profile TPO (Time Price Opportunity). Get valuable insights out of currencies, equities and commodities data. Gain an edge trading financial markets. Volume and TPO histogram bar and line charts. Volume Footprint charts. TPO letter and block marker charts including split structures. Versatile segmentation and compositing methods. Static, dynamic and flexible ranges with relative and/or absolute visualizations. Lay
Quantum Heiken Ashi PRO MT5
Bogdan Ion Puscasu
4.5 (8)
Wir stellen den   Quantum Heiken Ashi PRO   vor Die Heiken-Ashi-Kerzen wurden entwickelt, um klare Einblicke in Markttrends zu geben und sind bekannt für ihre Fähigkeit, Rauschen herauszufiltern und falsche Signale zu eliminieren. Verabschieden Sie sich von verwirrenden Preisschwankungen und begrüßen Sie eine glattere, zuverlässigere Diagrammdarstellung. Was den Quantum Heiken Ashi PRO wirklich einzigartig macht, ist seine innovative Formel, die traditionelle Candlestick-Daten in leicht lesbare
A key element in trading is zones or levels from which decisions to buy or sell a trading instrument are made. Despite attempts by major players to conceal their presence in the market, they inevitably leave traces. Our task was to learn how to identify these traces and interpret them correctly. Reversal First Impulse levels (RFI)   -  Version MT4                  INSTRUCTIONS                 RUS                 ENG                         R ecommended to use with an indicator   -  TREND PRO  
Was: $249  Now: $99   Market Profile defines a number of day types that can help the trader to determine market behaviour. A key feature is the Value Area, representing the range of price action where 70% of trading took place. Understanding the Value Area can give traders valuable insight into market direction and establish the higher odds trade. It is an excellent addition to any system you may be using. Inspired by Jim Dalton’s book “Mind Over Markets”, this indicator is designed to suit the
Dark Power MT5
Marco Solito
4.84 (56)
Dark Power  is an Indicator for intraday trading. This Indicator is based on   Trend Following  strategy, also adopting the use of an histogram to determine the right power . We can enter in good price with this Indicator, in order to follow the   strong trend   on the current instrument. The histogram is calculated based on the size of the bars and two moving averages calculated on the histogram determine the direction of the signal Key benefits Easily visible take profit/stop loss lines Int
Golden Gate Algo MT5
James David Lane
4 (6)
40% RABATT ZU WEIHNACHTEN! PREISERHÖHUNG AUF $250 AM 1. JANUAR! Vorstellung von GoldenGate Entries: Eine hochmoderne Handelslösung! Entdecken Sie einen revolutionären Ansatz zum Handel mit GoldenGate Entries (GGE), einem fortschrittlichen Indikator, der entwickelt wurde, um Ihr Handelserlebnis zu verbessern. GGE bietet eine umfassende Palette von Funktionen, um Benutzer mit Präzision und Vertrauen in ihren Handelsentscheidungen auszustatten. Paare: Beliebig (FX - Rohstoffe - Aktien - Akti
Gartley Hunter Multi
Siarhei Vashchylka
5 (5)
Gartley Hunter Multi - An indicator for searching for harmonic patterns simultaneously on dozens of trading instruments and on all classic timeframes: (m1, m5, m15, m30, H1, H4, D1, Wk, Mn). Manual (Be sure to read before purchasing) | Version for MT4 Advantages 1. Patterns: Gartley, Butterfly, Shark, Crab. Bat, Alternate Bat, Deep Crab, Cypher 2. Simultaneous search for patterns on dozens of trading instruments and on all classic timeframes 3. Search for patterns of all possible sizes. Fr
Weitere Produkte dieses Autors
Important Lines
Terence Gronowski
4.88 (26)
Important Lines Indikator (M1 - M15) Dieser Indikator zeigt Pivot-Lines, vortages Hoch und Tief, vortages Close und das Minimum und Maximum der vorherigen Stunde an. Sie müssen nur diesen einzelnen Indikator in das Diagramm ziehen, um alle diese wichtigen Linien zu haben. Sie können sich das Laden vieler einzelnen Indikatoren ersparen. Warum sind bestimmte Linien beim Traden so wichtig? Vortageshoch und -tief: Diese werden von Händlern beobachtet, die in einer Tages-Chart handeln. Sehr of
FREE
Swiss VWAPsimple
Terence Gronowski
5 (4)
Swiss VWAPsimple Motivation Ich fand keinen zuverlässigen gratis VWAP Indikator für MT5. VWAP ist ein sehr wichtiger Indikator. Aber Vorsicht, er ist unpräzise, insbesondere am Abend, falls die Summen schon sehr gross sind. Um den Computer zu schonen und Abstürze zu vermeiden wird der VWAP nur immer von Mitternacht aus gezeichnet. Bei geschlossenen Märkten wird nichts angezeigt, ausser man deaktiviert useBarsSinceMidnight. Was ist VWAP, wie wird er angewandt?  VWAP steht für Volume Weighed Ave
FREE
Swiss InsideOutsideBar
Terence Gronowski
5 (2)
Swiss InsideOutsideBar Die Bedeutung von Inside- und Outside Bars Inside Kerzen sind komplett durch die Vorgängerkerze umschlossen (Harami Muster). Outside Kerzen unschliessen die Vorgängerkerze.   Insidekerzen können eine kondensierte Form eines symmetrischen Dreicks darstellen, Symetrische Dreiecke sind der Ausdruck des Kampfes zwischen Bären und Bullen. Meist brechen symmetrische Dreiecke in die Richtung des übergeordneten Trends aus, das muss aber nicht immer der Fall sein. Eine Insidekerze
FREE
M5 Breakout Indicator
Terence Gronowski
3 (1)
Shows min and max of last M5 Candle. Can be used to trade breakouts of last M5 candle.  The M5 Candle Breakout Strategy avoids to stay too long in a sindways phase. See documentation on  @swisstrader3713, where you can follow my live trading. The only parameters are the color of the lines defining the M5 stretch. Best use the indicator in M1 timeframe. The M5 Breakout Strategy has helped me to reduce overtrading.
FREE
FasterShark
Terence Gronowski
5 (1)
FasterShark Trading Assistent Handeln ist wie Baden in einem Becken voller Haie. Um zu überleben, musst du der schnellere Hai sein. Das Tool hält Sie über alle Parameter auf dem Laufenden und erlaubt ein sehr schnelles Handeln ohne das Risiko zu vernachlässigen. Ich habe dieses Tool programmiert, um ständig über das Geschehen informiert zu sein. Früher habe ab und zu vergessen, einen Stopploss zu setzen. Diverse Fehler werden mit diesem Tool verhindert. Außerdem ermöglicht Ihnen dieses Tool,
FREE
Swiss ParabolicWarn
Terence Gronowski
5 (1)
Normal Parabolic SAR with label of long or short state. Tells also "Parabolic long" and "short". Can be used in multitimeframe layouts together with Swiss HolyGrail indicator or in different timeframes. So, if all the indicators show "long" or "short" you can be sure that the risk of a wrong direction is small. The standard values for Parabolic SAR are 0.02 for step and 0.2 for maximum. You may experiment with changing the maximum to get smother curves.  Note that changes in parabolic SAR are la
FREE
Swiss CandleTime
Terence Gronowski
5 (2)
Swiss CandleTime Wozu dieser Indikator CandleTime zeigt die verbleibende Zeit, bis die Kerze vollendet ist. Ich brauche diesen Indikator, falls ich das Halten einer Position im M3 Chart verwalte. Meist warte in in einem Aufwärtstrend eine erste rote M3-Kerze ab. Beginnt die folgende auch rot zu werden, stelle ich den Trade glatt.  Timeframes M1 bis H1 Inputs Arrow displayed => Editieren des Pfeilstrings Arrow for waiting conditions => Editieren des offline Pfeilstrings Text Color => Textfarbe Te
FREE
Swiss HolyGrail
Terence Gronowski
3 (1)
Swiss Holy Grail Indicator Motivation und Funktionsweise Der HolyGrail Indikator dient der Optimerung eines Einstiegs. Genau in diesem Moment habe ich mich ertappt, dass ich in einem Aufwärtstrend short gegangen bin, also antizyklisch eingestiegen bin. Oder ich bin ein einen viel zu reifen Trend eingestiegen. Solche Fehler dieser Indikator verhindern: Man sollte sich immer bewusst sein, ob an pro- oder antizyklich einsteigt, auch muss man immer über die Reife des Tends bescheid wissen. Linda Ras
FREE
RSI talking, benutze alle deine Sinne beim Handeln! Die Idee Beim Trading können deine Augen sehr beansprucht werden. Deshalb habe ich RSItalking programmiert, der dir sagt, wenn der RSI in einem Extembereich steht. Handel, was du siehst und was du hörst ! Funktion Dieser Indikator sagt "rsioverbought", wenn der rsi über einem Schwellenwert liegt (Standard 75%) und "rsioversold", wenn er unter einem unteren Grenzwert liegt (Standard 25%). Wenn Sie eine Long-Position halten, empfehlen w
FREE
Auswahl:
[Gelöscht] 2019.11.02 18:48 
 

Der Benutzer hat keinen Kommentar hinterlassen

[Gelöscht] 2019.01.14 06:59 
 

Der Benutzer hat keinen Kommentar hinterlassen

Antwort auf eine Rezension
Version 1.3 2019.05.22
The Stretch Label was not updated. This error is corrected.
Version 1.2 2019.02.05
Now several timeframes and several assets can be tagged with the opening range. Variables are saved in global variables. watch dem pressing f3.
Version 1.1 2019.01.29
Now change of timeframe is possible, the lines remain. Added the Opening Line.