BB Color
- Indikatoren
-
Dmitriy Moshnin
 Торговать нужно так, чтобы не было мучительно больно за бесцельно вложенные деньги...
 - Version: 1.0
- Aktivierungen: 5
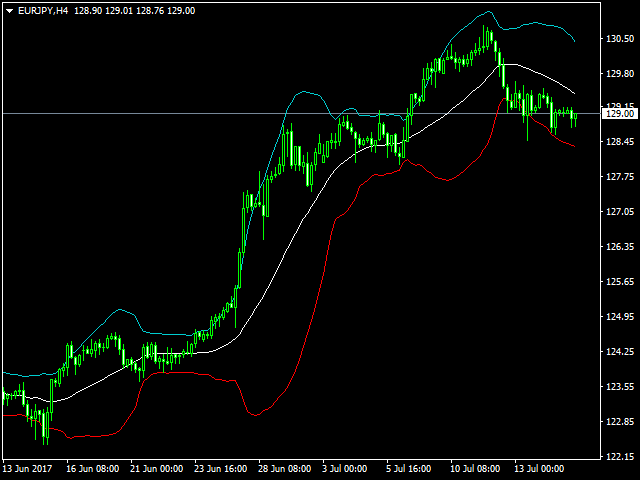
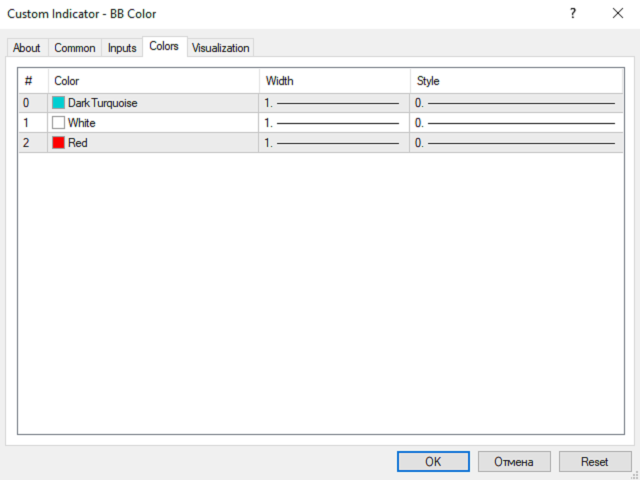
Bollinger Bands Color unterscheidet sich vom herkömmlichen Indikator durch einen zusätzlichen Satz von Parametern. Solche Parameter wie Farbe und angewandter Preis können im Eigenschaftsfenster für jede Linie separat ausgewählt werden. Außerdem können Sie die Mittelwertbildungsmethode für die mittlere Linie auswählen.
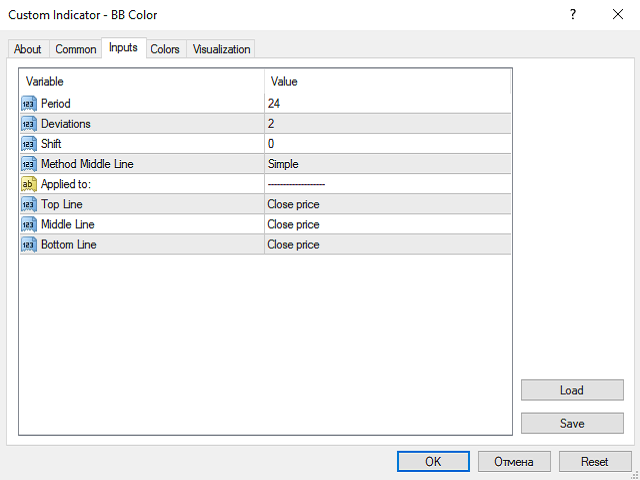
Parameter
- Periode - Periode der Mittelwertbildung für die Berechnung des Indikators;
- Abweichungen - Anzahl der Standardabweichungen von der Hauptlinie;
- Verschiebung - Verschiebung des Indikators im Verhältnis zum Preisdiagramm;
- Methode Mittellinie - Mittelungsmethode der Mittellinie: einfach, exponentiell, geglättet und linear-gewichtet;
- Angewandt auf - angewandter Preis: Close, Open, Low, Median, Typical und Linear-Weighted - für jede Linie separat;
- Obere Linie - angewandter Preis für die obere Linie;
- Mittlere Linie - angewandter Preis für die mittlere Linie;
- Untere Linie - angewandter Preis für die untere Linie.

Der Benutzer hat keinen Kommentar hinterlassen