BB Color
- Indicadores
-
Dmitriy Moshnin
 Торговать нужно так, чтобы не было мучительно больно за бесцельно вложенные деньги...
 - Versión: 1.0
- Activaciones: 5
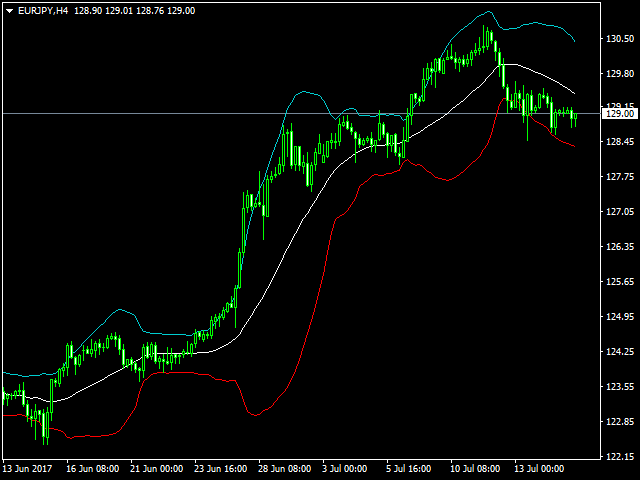
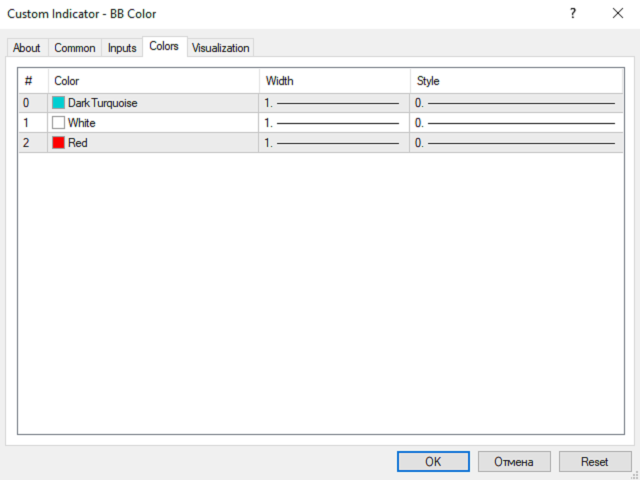
Bollinger Bands Color se diferencia del indicador convencional por un conjunto adicional de parámetros. Tales parámetros como el color y el precio aplicado se pueden seleccionar en la ventana de propiedades para cada línea por separado. Además, puede seleccionar el método de promediación para la línea central.
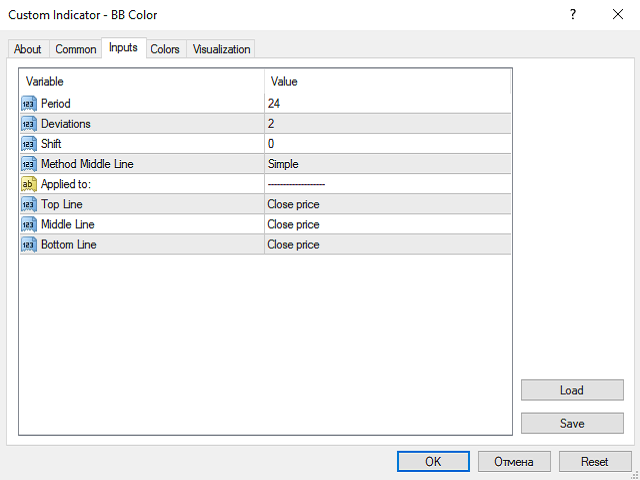
Parámetros
- Período - período de promediación para el cálculo del indicador;
- Desviaciones - número de desviaciones estándar de la línea principal;
- Desplazamiento - desplazamiento del indicador en relación con el gráfico de precios;
- Método Línea Media - método de promediación de la línea media: simple, exponencial, suavizado y lineal ponderado;
- Aplicado a - precio aplicado: Close, Open, Low, Median, Typical y Linear-Weighted - para cada línea por separado;
- Líneasuperior - precio aplicado para la línea superior;
- Líneamedia - precio aplicado para la línea media;
- Líneainferior - precio aplicado para la línea inferior.

El usuario no ha dejado ningún comentario para su valoración