RenkoIchimoku
- Indikatoren
-
Sergey Deev
 I'm implementing your ideas in MQL4: https://www.mql5.com/ru/job/new?prefered=work2it
 - Version: 1.1
- Aktualisiert: 18 November 2021
- Aktivierungen: 5
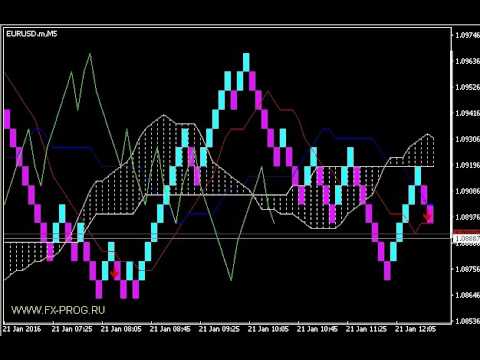
Der Indikator zeigt Renko-Balken an, verwendet deren Daten zur Berechnung und Anzeige des Ichimoku-Kinko-Hyo-Indikators und liefert Kauf-/Verkaufssignale.
Renko ist eine nicht-triviale Preisanzeigemethode. Anstatt jeden Balken innerhalb eines Zeitintervalls anzuzeigen, werden nur die Balken angezeigt, bei denen sich der Kurs um eine bestimmte Anzahl von Punkten bewegt hat. Renko-Balken hängen nicht von einem Zeitintervall ab, daher funktioniert der Indikator auf jedem Zeitrahmen, ohne seine Effizienz zu verlieren.
Der Indikator erzeugt zwei Signale:
- Wenn die Tenkan-Sen-Linie über dem Kijun-Sen und der Кumo-Wolke liegt, während der Kurs sie nach oben durchquert - das erste Kaufsignal (das Verkaufssignal ist das Gegenteil);
- Wenn der Tenkan-Sen und der Kijun-Sen über der Кumo-Wolke liegen, während der Tenkan-Sen den Kijun-Sen nach oben kreuzt - das zweite Kaufsignal (das Verkaufssignal ist das Gegenteil davon);
Die Signale werden als Pfeile, Nachrichten in einem Pop-up-Fenster, E-Mails und Push-Benachrichtigungen angezeigt. Der Indikator generiert auch das benutzerdefinierte Ereignis EventChartCustom, um das Signal für die Handelsautomatisierung zu verwenden. Das vom Indikator erzeugte Ereignis kann vom EA in der Funktion OnChartEvent verarbeitet werden. Der Indikator übergibt die folgenden Parameter an den Event-Handler: id - Identifikator; dparam - Wert für die Platzierung eines Stop Loss; sparam - Textnachricht.
Parameter
- RenkoBar - Größe des Renko-Balkens in Punkten (wird bei fünfstelligen Kursen automatisch neu berechnet);
- CountBars - Anzahl der Renko-Balken, die auf einem Chart angezeigt werden;
- bearColor - Farbe der bärischen Renko-Balken;
- bullColor - Farbe der bullischen Renko-Balken;
- hideBars - Flagge zum Ausblenden von Standard-Balken auf einem Diagramm;
- tenkan_sen, kijun_sen, senkou_span_b - entsprechende Ichimoku Parameter;
- tenkan_sen_color, kijun_sen_color, chikou_span_color, up_kumo_color, down_kumo_color - Farben der Ichimoku Linien;
- SignalBuyColor - Farbe der Kaufsignalpfeile;
- SignalSellColor - Farbe der Verkaufssignalpfeile;
- useSignal_1 - erlaube Signal 1;
- useSignal_2 - erlaube Signal 2;
- useAlert - Popup-Warnungen;
- useMail - E-Mail-Benachrichtigungen;
- useNotification - Push-Benachrichtigungen;
- CustomEventBuy - benutzerdefinierte Kaufereigniskennung (0 - deaktiviert);
- CustomEventSell - benutzerdefinierte Kennung für Verkaufsereignisse (0 - deaktiviert).