MACD Histo Smart
- Indicatori
- Versione: 1.22
- Aggiornato: 18 luglio 2024
- Attivazioni: 7

Description
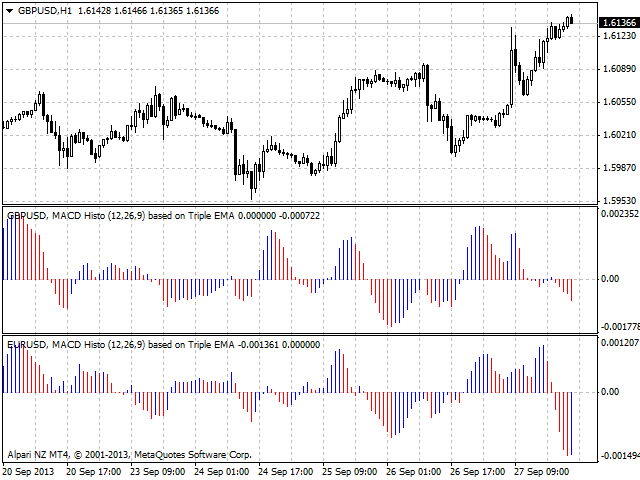
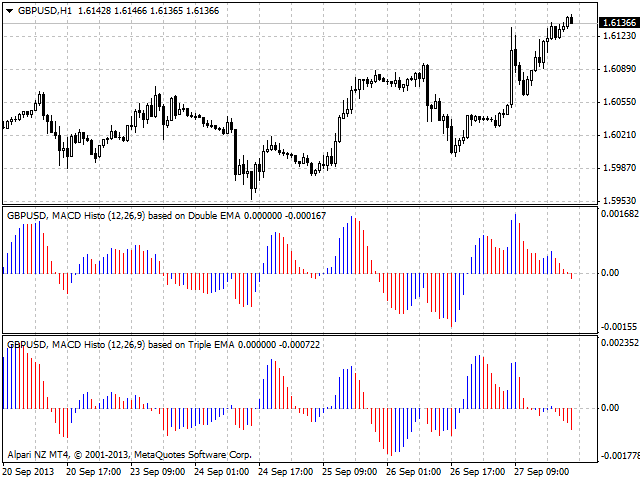
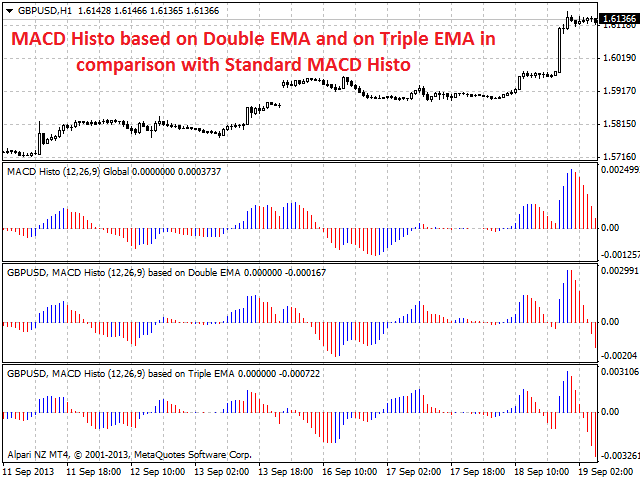
A colored universal multicurrency/multi-symbol indicator MACD Histo Smart (MACD histogram) based on double or triple moving average.
Comparing to the standard MACD Histo this indicator is more sensitive to what allows generating advance signals.
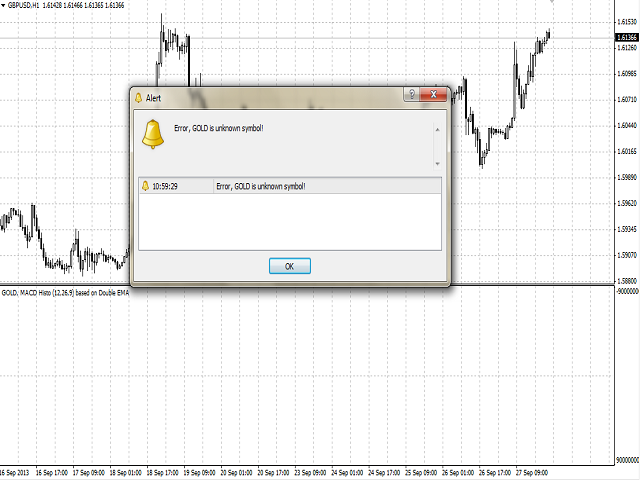
he indicator may be used with any broker, irrespective of the name of the financial instrument since it is necessary to manually enter the name as an input parameter. If you enter a non-existent or incorrect name of a financial instrument, you will receive an error message that this financial instrument is unknown (does not exist).
You can select coloring for the rising and falling lines of the indicator histogram.
Purpose
The indicator can be used for manual or automated trading within an Expert Advisor. For automated trading, use any indicator buffer of the double:
- Main line of the indicator - buffer 4.
- Rising line of the histogram - buffer 0, must not be equal to zero.
- Falling line of the histogram - buffer 1, must not be equal to zero.
Input Parameters
- Currency_Name - name of the financial instrument.
- Calc_Method - method of calculation of the indicator:
- on the basis of double moving average (default).
- on the basis of triple moving average.
- FastMA - period of the fast moving average.
- SlowMA - period of the slow moving average.
- SignalMA - period of the signal line of the basic and/or calculated indicator.
- MA_Method - method of averaging of the basic indicator MA.
- Signal_Method - method of averaging of the signal line.
- Applied_Price - price used for the basic and/or calculated indicator.
- Shift - shift of the basic indicator relative to the price chart.