Pivot System
- Indikatoren
- Version: 1.25
- Aktualisiert: 24 Juli 2024
- Aktivierungen: 7

Beschreibung
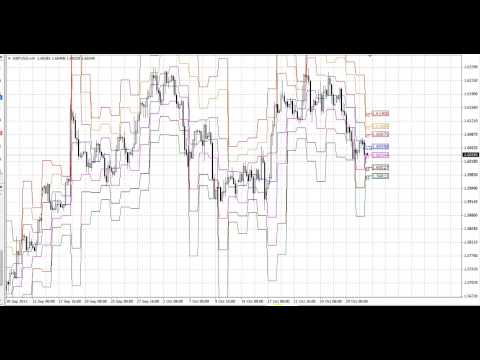
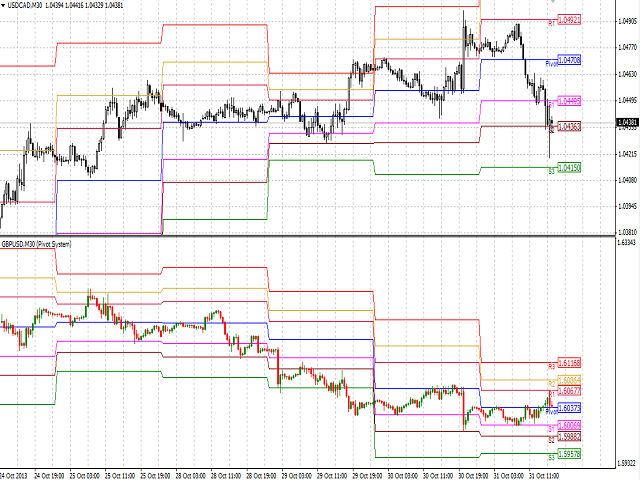
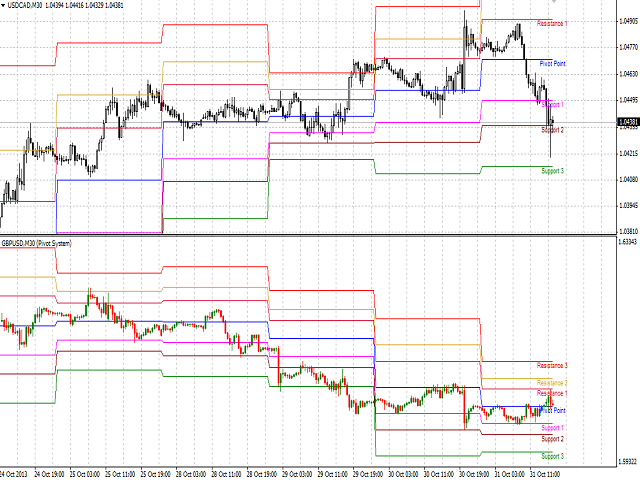
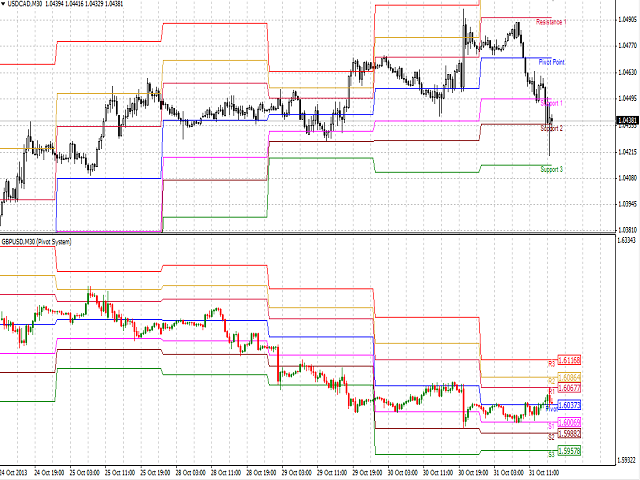
Pivot System ist ein universeller farbiger Multiwährungs-/Multisymbol-Indikator der Pivot Points Level Systeme. Sie können eine der drei Versionen wählen: Standard Old, Standard New und Fibo.
Er zeigt die Pivot-Levels in einem separaten Fenster an.
Das System berechnet den Pivot-Punkt automatisch auf der Grundlage der Marktdaten des Vortages(PERIOD_D1) und des Systems der Unterstützungs- und Widerstandsniveaus (jeweils drei). Es kann auch Kursmarken für jedes Niveau anzeigen.
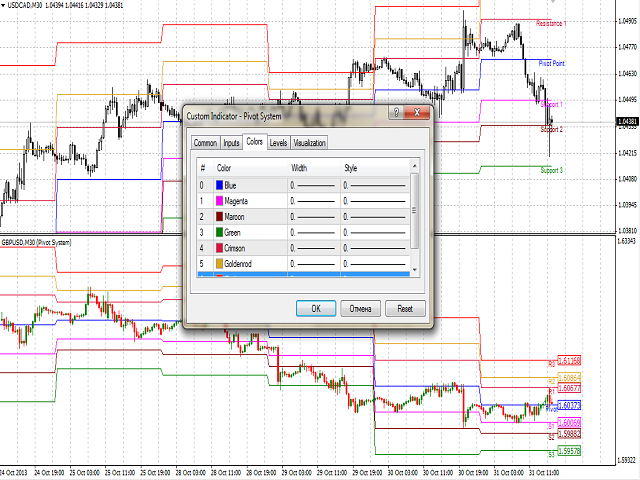
Sie können die Indikatorlinien einfärben.
Der einzige Unterschied zwischen der Standard New und der Standard Old Version ist die Berechnungsmethode des dritten Levels von Unterstützung (S3) und Widerstand (R3).
Bitte sehen Sie sich das beigefügte Video an, um die Unterschiede zwischen den drei Versionen zu sehen (Zur Verdeutlichung wird die Visualisierung im Hauptfenster vorgenommen).
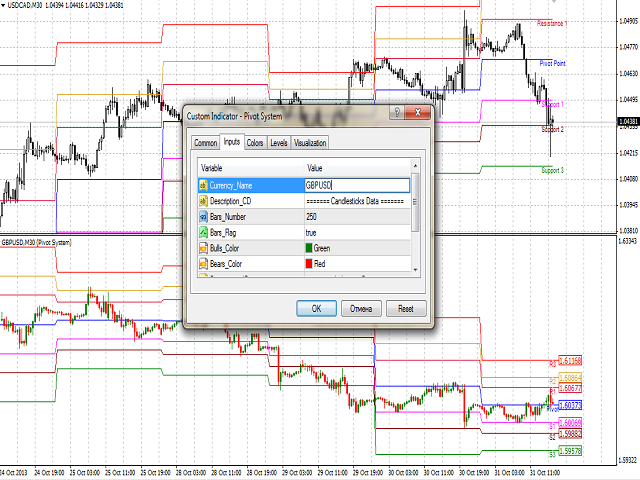
Eingaben
- Currency_Name - der Name des Finanzinstruments.
- Bars_Number - die Anzahl der Bars, die in einem separaten Fenster angezeigt werden sollen.
- Bars_Flag - ein Flag, das die Anzeige der im Parameter Bars_Number angegebenen Anzahl von Bars erlaubt:
- true - entsprechend Bars_Number.
- false - maximal verfügbare Balken in der Historie.
- Bulls_Color - die Farbe des bullischen Candlesticks.
- Bears_Color - die Farbe der bearish candlestick.
- Bid_Line_Color - Farbe der Bid-Linie.
- Calc_Method - die Methode zur Berechnung der Pivot-Punkte:
- Standard Alt.
- Standard Neu.
- Fibo.
- Price_Flag - Erlaubnis zur Anzeige von Preisschildern.
Standardmäßig berechnet das System die Niveaus auf der Grundlage der Methode Standard Old.
Zweck
Der Indikator kann für den manuellen oder automatisierten Handel in einem Expert Advisor verwendet werden. Werte von Indikatorpuffern des Typs Double können für den automatisierten Handel verwendet werden:
- Pivot-Punkt - Puffer 0.
- Unterstützungsniveau 1 - Puffer 1.
- Unterstützungsniveau 2 - Puffer 2.
- Unterstützungsniveau 3 - Puffer 3.
- Widerstandsniveau 1 - Puffer 4.
- Widerstandsniveau 2 - Puffer 5.
- Widerstandslevel 3 - Puffer 6.
Je nach Zeitrahmen des Charts, auf dem der Indikator verwendet wird, sollten die Werte der Indikatorpuffer in Richtung der Tiefe der Historie mit einer Verschiebung relativ zum Null-Bar und dem gleichen Schritt nach dem folgenden Prinzip angefordert werden:
- PERIOD_M1: die Verschiebung und der Schritt = 1440.
- PERIOD_M5: die Verschiebung und der Schritt = 288.
- PERIOD_M15: die Verschiebung und der Schritt = 96.
- PERIOD_M30: die Verschiebung und der Schritt = 48.
- PERIOD_H1: die Verschiebung und der Schritt = 24.
- PERIOD_H4: die Verschiebung und der Schritt = 6.
- PERIOD_D1: die Verschiebung und der Schritt = 1.
Beschränkungen
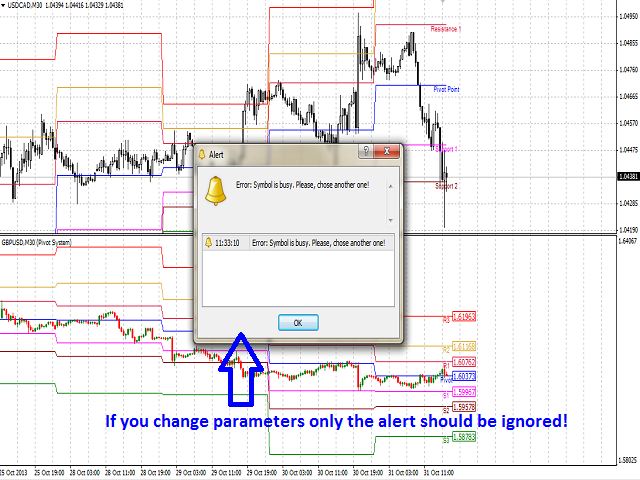
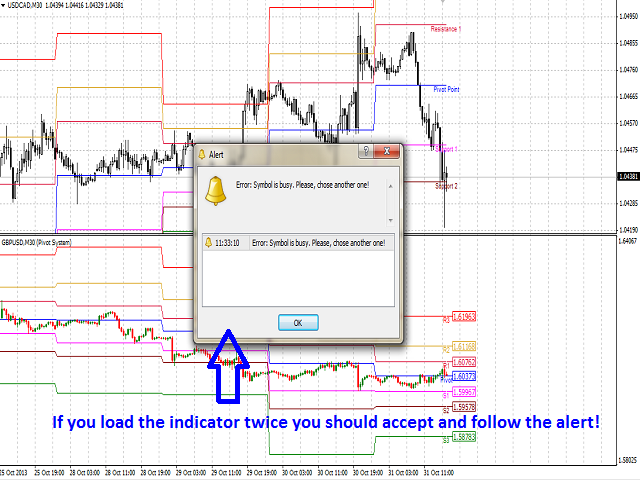
Der Chart für jedes Finanzinstrument kann nur einmal angezeigt werden. Andernfalls erhalten Sie eine Fehlermeldung in Bezug auf die Wiederverwendung und werden aufgefordert, ein anderes Finanzinstrument auszuwählen.
Empfehlungen
Es wird empfohlen, den Indikator mit dem Parameter Bars_Number zu verwenden, der die Anzahl der Bars, die in einem Fenster angezeigt werden können, nicht überschreitet (etwa 250 Bars).
Hinweise
Im Falle eines Verbindungsverlustes mit dem Handelsserver wird das Diagramm bei Wiederherstellung der Verbindung und beim Herunterladen der Daten von Anfang an bis zu der durch Bars_Number und Bars_Flag festgelegten Anzahl von Bars neu gezeichnet.


Der Benutzer hat keinen Kommentar hinterlassen